
INTRODUCTION
HIV (Human immunodeficiency virus) is a chronic infectious viral infection that attenuates the host immune system without any cure, and persists throughout life with progression into the life-threatening condition known as AIDS (acquired immunodeficiency syndrome). The global burden of people living with HIV (PLHIV) was 38.4 million (33.9–43.8 million) with an estimated 650000 (510000– 860000) people dying from the disease in 2021. In spite of a manifold improvement in the antiretroviral therapy treatment availability and accessibility with concomitant accelerated implementation of awareness campaigns in the last 3 decades, nearly 2 million annual incident infections are reported each year1,2. In 2019, globally, HIV infection caused 47.63 million Disability Adjusted Life Years (DALYs), a 1.28-fold increase from 19903.
The Joint United Nations Program on HIV/AIDS (UNAIDS) 90-90-90 targets commits countries to strengthen HIV testing and treatment facilities to diagnose 90% PLHIV, initiate effective treatment in 90% of PLHIV diagnosed, and achieve viral suppression in 90% of those initiated on therapy by 2020 with a further expansive 95-95-95 treatment target established for 2030. However, the global HIV care continuum at 81-67-59, despite indicative of significant progress since 2020, is substantially off-track in meeting the desired targets4. The objectives of the 2030 Sustainable Development Goal 3 are to attain good health and well-being for all5,6. The AIDS epidemic is a barrier that threatens the achievement of these goals which therefore commits to ‘Ending the AIDS epidemic as a public health threat’ (SGD-3, Target 3.3)7.
India has the third highest absolute burden of HIV in the world with an estimated 2.3 million PLHIV in 2021 of which 63 thousand were newly infected, while 42 thousand annual deaths were attributable to the disease. Furthermore, only 77% PLHIV were aware of their diagnosis and only 65% PLHIV were initiated on ART therapy8. From the perspective of a developing and youthful lower middle-income country such as India, HIV/AIDS severely undermines health, and social and economic development.
To control and end the AIDS epidemic in India, the National AIDS Control Organization (NACO), under the Ministry of Health and Family Welfare (MoHFW) beginning since 1992, has undertaken five phases of the National AIDS Control Program (NACP). It has achieved substantial success in lowering the annual incidence of new HIV infections by two-thirds and death rate by more than half (54%) in the past two decades9.
Furthermore, the country prevalence is steadily declining from its peak level of 0.54% in 2000–2001 to 0.22% in 202010. Although overall prevalence is low, there is significant regional disparity among states, with higher averages in Mizoram, Nagaland, and Manipur. Other States/UTs estimated to have adult HIV prevalence higher than the National average are Andhra Pradesh, Meghalaya, Telangana, Karnataka, Delhi, Maharashtra, Puducherry, Punjab, Goa, and Tamil Nadu10. These significant inter-state variations signify the need for accelerated and comprehensive prevention efforts towards population risk reduction by up to 80% by 202511.
Reducing HIV transmission through avoidance of unsafe sexual behaviors and injectable drug use, voluntary and informed testing on making risky contact, and adherence to ART in diagnosed patients are dependent on the population awareness and attitudes towards HIV/AIDS. Poor knowledge, attitudes, and practice (KAP) related to HIV/AIDS is also linked with higher HIV stigma, which is a major barrier in testing, diagnosis, and adherence to regular treatment that precludes viral suppression and contributes to persistence of the chain of transmission, and reduced quality of life, and risk of opportunistic infection, and higher mortality in infected patients12.
HIV/AIDS epidemic in India has a high degree of heterogeneity that regulates the dynamics of population transmission and epidemiological burden of the disease. Higher burden of HIV/AIDS has been observed in high-risk groups such as female sex workers (FSWs), men having sex with men (MSM), injectable drug users (IDUs), occupations such as truckers, low socioeconomic status (SES) population, and migrants amongst others. Consequently, HIV risk is a function that combines adverse social determinants driving existing high-risk behavior and poor awareness13,14.
Public awareness of HIV/AIDS should be the cornerstone of managing the AIDS epidemic in absence of curative treatment or vaccination15. Previous studies have suggested that lack of accurate and complete knowledge of HIV, especially on the modes of the infection transmission, is a major driver of incident HIV infections16,17. However, since knowledge alone cannot suffice to prevent infection, it must be accompanied by practice in order to achieve the desired results18. In order to develop effective educational and awareness campaigns to combat this major public health problem, it is imperative to assess population knowledge and practice of HIV/AIDS.
Previous investigations into the knowledge and attitude towards HIV/AIDS in the general and high-risk populations in India have suggested significant variability in responses with most studies of moderate quality, lacking adequate sample size, with nearly half of the studies conducted in the Southern Indian states. Furthermore, most studies used self-designed questionnaires that failed to assess comprehensive knowledge and attitude towards HIV/AIDS19.
Therefore, the study objective was to determine the proportion and predictors of comprehensive knowledge and attitude of HIV/AIDS in the Indian population through a large, nationally representative demographic and health survey. Furthermore, the study findings were compared with the preceding round of the survey.
METHODS
Data source
A repeated cross-sectional analysis that utilized Demographic Health Survey (DHS) data from India’s National Family Health Survey Fifth Series (NFHS-5), 2019–2021, and NFHS-4 (2015–2016) was conducted. Access to the dataset was obtained from DHS after review of the submitted proposal.
NFHS surveys provide data on India’s population and health for 707 districts, 28 states and 8 Union Territories. International Institute for Population Sciences (IIPS), Mumbai, is the nodal agency that conducts these surveys under the direction of MoHFW, Government of India. NFHS-5 is a two-stage stratified sample. Primary sampling units were villages in rural areas and CEBs (Census Enumeration Blocks) in urban areas and these PSUs were selected based on the PPS (probability proportional to size) sampling method. The NFHS-5 included a sample of 202052 participants while the NFHS-4 included 225876 participants.
NFHS-5 consisted four survey questionnaires: Household, Woman, Man and Biomarker. The Men and Women questionnaires collected information from candidates aged 15–54 and 15–49 years, respectively, through face-to-face interviews by trained field investigators. Two set of questionnaires (district and state module) were used for women while men had just one questionnaire (state module only). The women state module consisted of 15% subsample of district module that contained questions around knowledge, attitude, sources, prevention of HIV/AIDS, HIV stigma and other sexually transmitted infections. In our study, information was collected from a sample of men and women, aged 15–49 years, who consented to answer the HIV/AIDS section and totaled up to 108785 women and 93267 men20.
Outcome variables
Comprehensive knowledge of HIV/AIDS
This composite variable that applies the Demographic and Health Surveys (DHS) definition of comprehensive knowledge of HIV21 was considered, which included men and women who responded ‘Yes’ to the following questions: ‘know that a healthy-looking person can have HIV’, and ‘know that consistent use of condoms every time they have sex and having just one uninfected faithful sex partner can reduce their chances of getting infected’; and reject two common misconceptions: 1) HIV can be transmitted by mosquito bites, and 2) one can get infected by sharing food with HIV-infected person.
Attitude towards HIV/AIDS
A positive attitude towards HIV was considered when an individual responded ‘Yes’ to three questions: ‘would they buy vegetables from a shopkeeper/vendor who is infected’, ‘female teacher who has HIV/AIDS but is not sick should be allowed to continue teaching’, and ‘willingness to take care for a relative with HIV/AIDS in own home’; and responded ‘No’ to the question ‘would want HIV infection in family to remain a secret’.
Mother-to-child HIV transmission
The proportion of men and women who were aware of the routes of transmission of HIV from mother to child were compared between NFHS-4 and NFHS-5. Individuals who responded ‘yes’ to all three questions: ‘HIV transmitted during pregnancy’, ‘during delivery’ and ‘during breastfeeding’ were considered to have the knowledge of HIV transmission.
Independent variables
The confounding variables were selected based on literature review such as age, gender, education level (no education, primary, secondary or higher education), residence (urban, rural), religion (Hindu, Muslim, Christian, Other), occupation (employed, unemployed, don’t know) and exposure to media in terms of frequency of watching television, listening to radio and reading newspapers (not at all, less than once a week, more than once a week), and marital status categorized as: never in union, married, widowed, no longer living together wherein divorced category was clubbed under no longer living together. Wealth index of household was also considered as a covariate. According to DHS these household scores were derived from PCA (principal component analysis). Wealth index had 5 quintiles/categories (poorest, poorer, middle, richer, richest)20.
Data and statistical analysis
Before commencing the analysis, values of the variables were checked for their plausibility. Appropriate weights were applied throughout the analysis to restore the representativeness, and frequencies were retrieved using the svy command in STATA version 15.1 (Stata Corporation, College Station, TX, USA). Individual men and women weights were applied while calculating the unadjusted and adjusted odds ratios while state weights were used to construct a graph. States were classified into low and high burden states according to their HIV prevalence as per India HIV estimates, 2020 Technical Brief22. States with adult HIV prevalence greater than the average HIV prevalence of India were categorized as high burden states while the remaining states were placed in the low burden category for both NFHS-4 and NFHS-5.
Bivariate analysis was performed to calculate the weighted unadjusted odds ratio (OR) for 95% confidence interval for all independent variables. Variables with p<0.05 were retained and included in the binary logistic regression model to estimate the factors that were independently associated with comprehensive knowledge and positive attitude towards PLHIV. Factors for which significant associations were observed in the bivariate model were included in the multivariate model. Before running the multivariate regression model, multicollinearity was checked to get true estimates. To detect multicollinearity, the correlation coefficients of each independent variable with the others were calculated, before running the regression model. Any correlation values >0.8 were considered to indicate presence of collinearity. As part of post-estimation test, goodness-of-fit was assessed to check whether the model fits the data accurately. High and low burden states of India, considering the national prevalence as the benchmark, were obtained from the HIV estimates technical brief 202020. A p<0.05 was considered statistically significant.
RESULTS
A total of 202052 participants was analyzed in this study including 46.3% male and 53.7% female participants. A majority of the male (58.14%) participants had at least a secondary education and 80.46% were employed, while among female participants, a majority (69.55%) were unemployed, and 22.55% lacked any formal education (Supplementary file Table 1).
In all, 25.80% of the respondents had comprehensive knowledge of HIV, whereas 26.54% showed a positive attitude towards HIV in NFHS-5 (2019-21) compared with 26.38% respondents having a comprehensive knowledge on HIV and 28.67% reflecting a positive attitude towards HIV in NFHS-4 (2015–2016). Moreover, 48.21% and 58.56% respondents in the NHFS-4 and NFHS-5 survey, respectively, were aware of the possibility of mother-to-child transmission of HIV.
Table 1 gives the knowledge of HIV in the study participants. More than three-fourths of the participants were aware that consistent condom use was protective against HIV, that healthy looking persons could have HIV, and having only one faithful uninfected sex partner reduces the risk of HIV, whereas nearly 60% of respondents rejected at least two misconceptions about HIV. More than 70% of the people reported the willingness to care for a HIV infected relative and supported teaching by a HIV infected female teacher, while 66.64% agreed to buy vegetables from a HIV infected vendor.
Table 1
Knowledge of HIV/AIDS in the Indian population (aged 15–49 years), National Family Health Survey–5 (2019–2021), cross-sectional survey (N=183650)
The odds of having comprehensive knowledge of HIV were 1.38 times greater in men compared to women. On adjusted analysis, higher comprehensive knowledge of HIV was independently associated with respondents belonging to the upper wealth quartile (AOR=1.86; 95% CI: 1.74–2.00), have higher level of education (AOR=2.36; 95% CI: 2.19–2.55), urban residence (AOR=1.07; 95% CI: 1.06–1.15), reading newspapers at least once a week (AOR=1.42; 95% CI: 1.38–1.53) and watching television at least once a week (AOR=1.40; 95% CI: 1.33–1.47) (Table 2). Individuals aged 30–39 years had the highest odds of possessing comprehensive knowledge of HIV compared to other age groups. However, marital status was not significantly associated with HIV knowledge.
Table 2
Logistic regression analysis of factors associated with having comprehensive knowledge of HIV/AIDS (N=202052)
Table 3 gives the distribution of sociodemographic factors with their attitude towards HIV; male respondents (AOR=1.19; 95% CI: 1.15–1.24), respondents with secondary education (AOR=1.46; 95% CI: 1.39–1.54), individuals aged 30–39 years (AOR=1.33: 95% CI: 1.24–1.42), respondents of other religions (AOR=1.34; 95% CI: 1.21–1.48) and those who frequently read newspapers (AOR=1.19; 95% CI: 1.13–1.25) and watch television (AOR=1.11; 95% CI: 1.06–1.17) had a positive attitude towards HIV. Negative attitude towards HIV was predominantly observed in the richer quintiles, however the adjusted odds for the richest respondents were insignificant (AOR=1.06; 95% CI: 0.99–1.14). Factors such as residence and marital status, after adjusting for other factors, were not statistically significant.
Table 3
Logistic regression of factors associated with attitude towards HIV in the Indian population (N=202052)
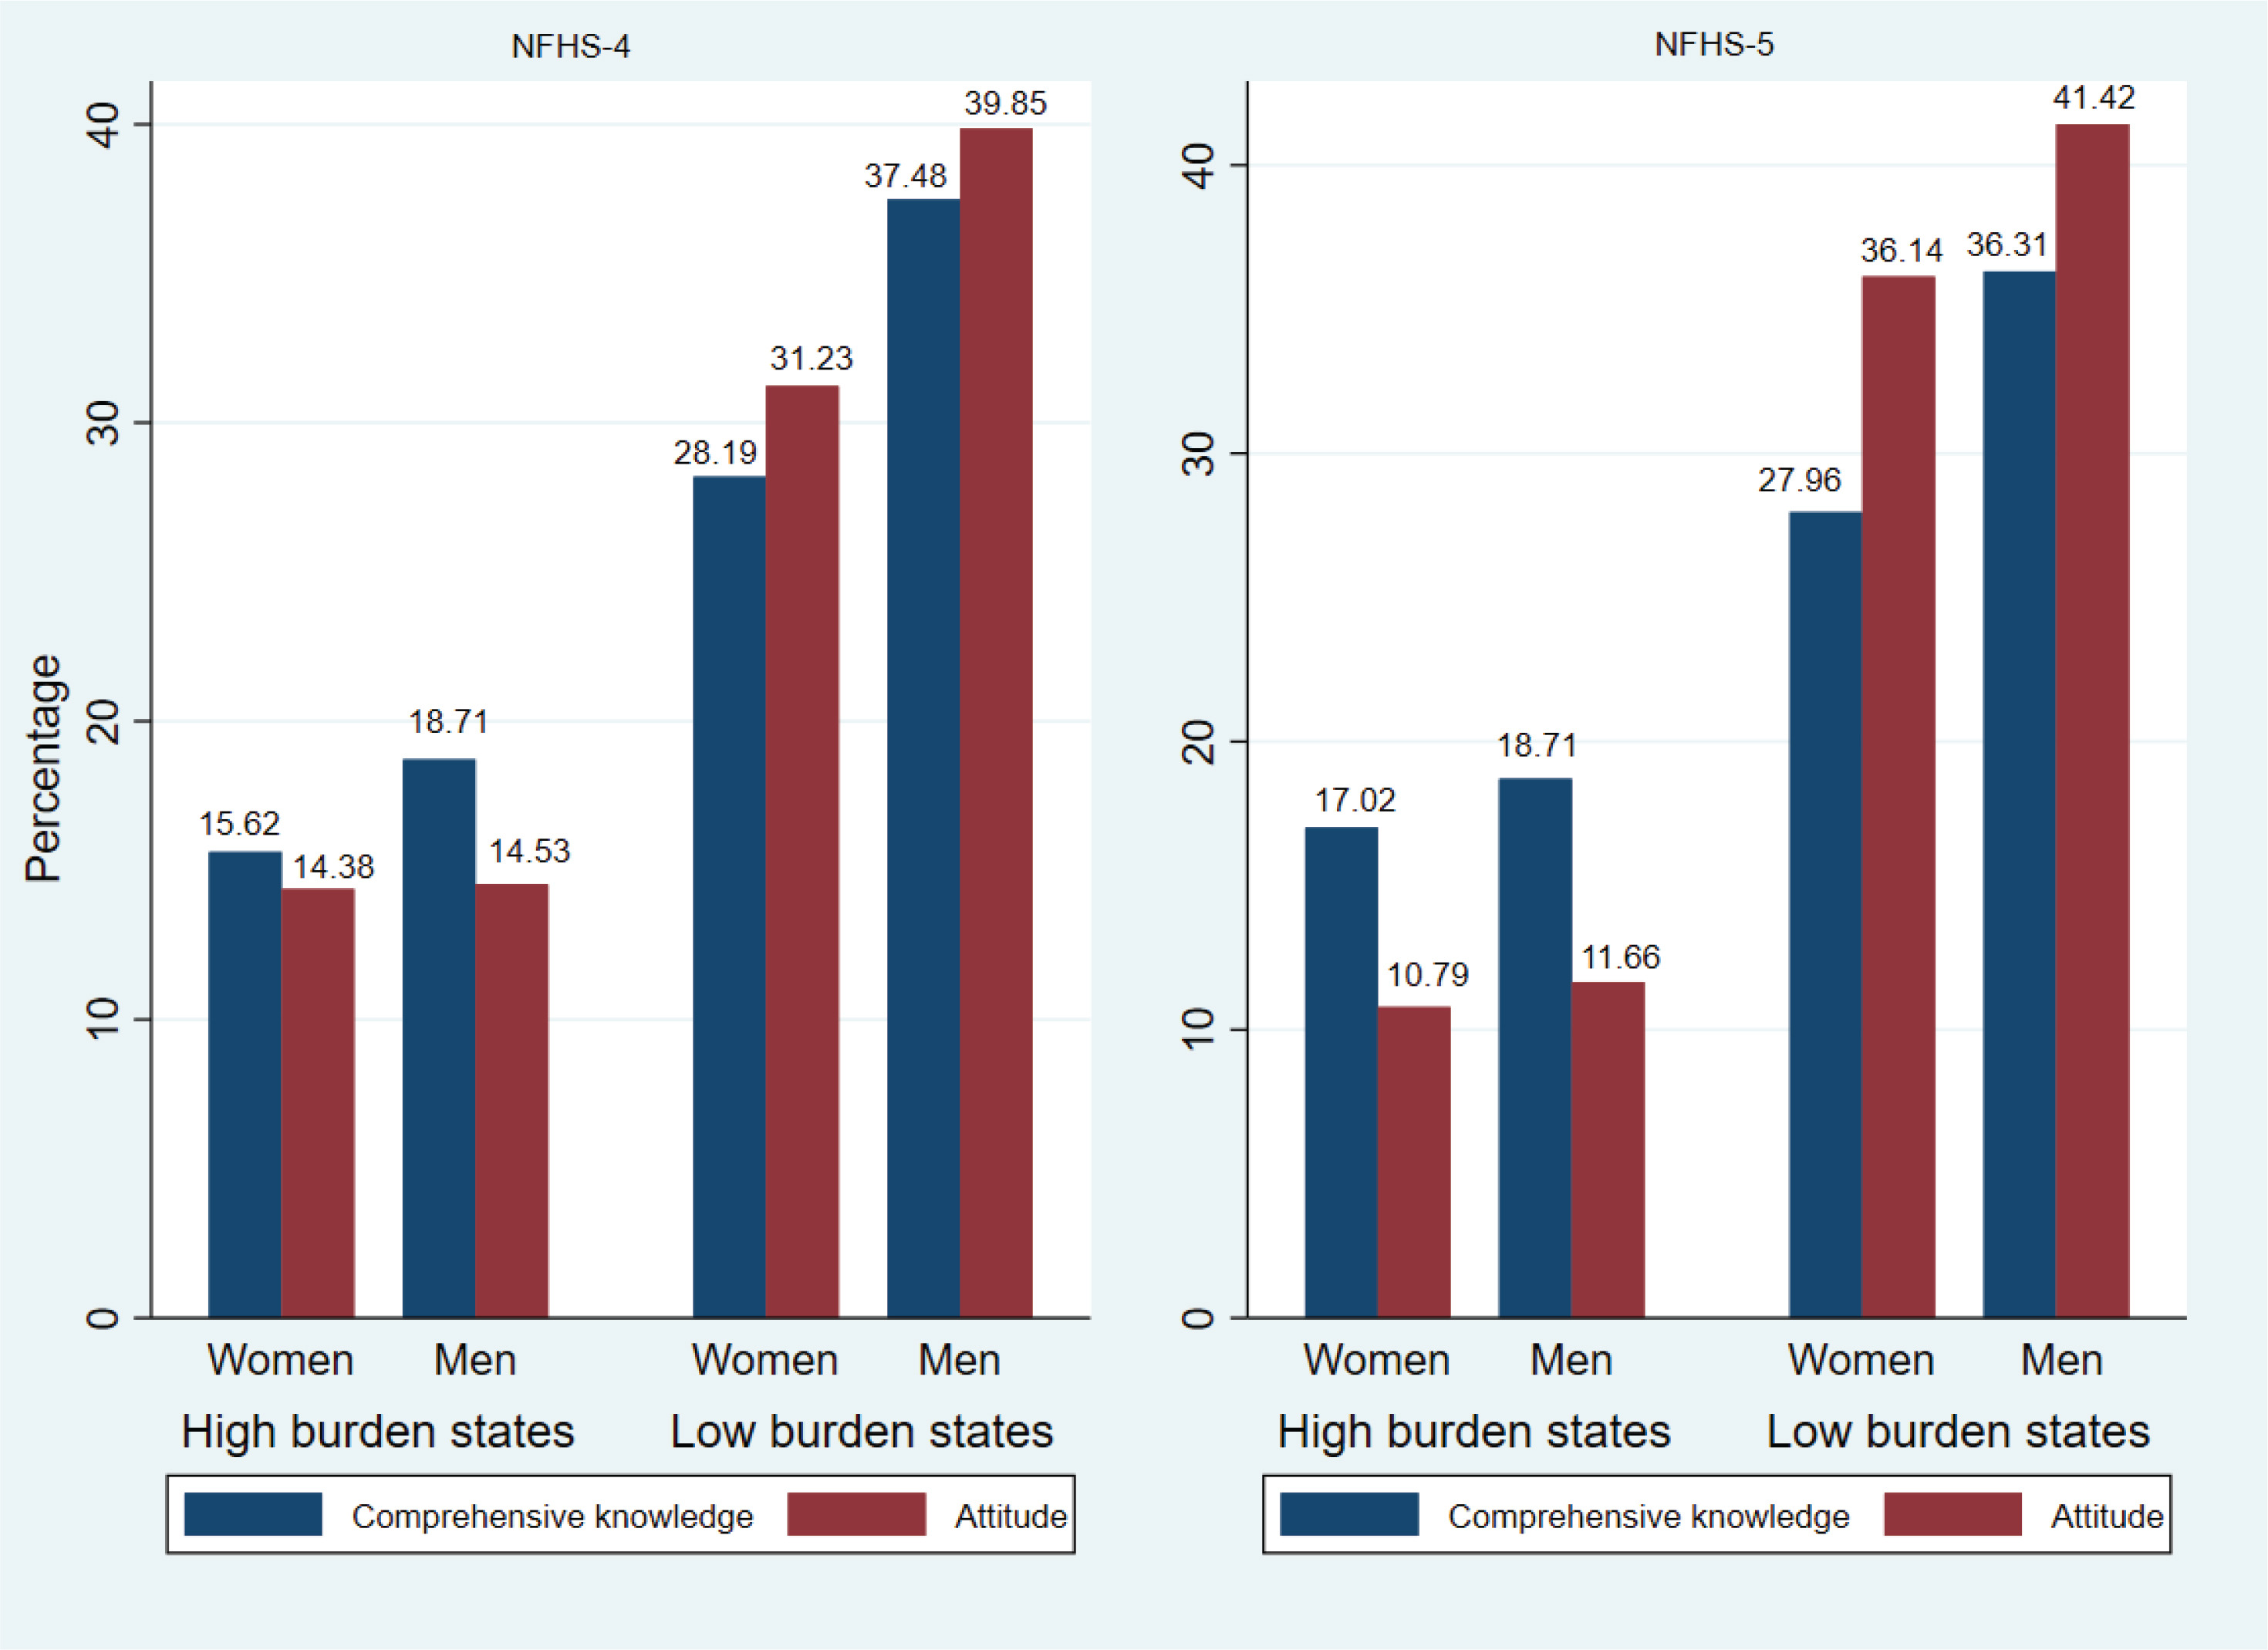
Figure 1 illustrates that in NFHS-4, 15.62% women and 18.71% men had good knowledge of HIV. However, in NFHS-5 the comprehensive knowledge of HIV among men remained stagnant, nearly a 2% increase in HIV knowledge among women was observed. Knowledge and attitude among male and female respondents was fairly similar in low burden states during NFHS-4 and NFHS-5, whereas a slight decline in attitude towards HIV was detected among respondents of high burden states in NFHS-5.
DISCUSSION
This study estimated the proportion and predictors of comprehensive knowledge of HIV and attitude among Indian adults aged 14–49 years in a nationally representative dataset. Among the respondents, approximately one in four (25.80%) had comprehensive knowledge of HIV and a positive attitude (26.54%) which, when compared to NFHS-4 (2015–2016), suggested a mild increase in the knowledge but a decline in positive attitude towards HIV20,23. A meta-analysis of 47 HIV-AIDS KAP studies from 2010–2020 estimated 75% knowledge and a 40% negative attitude towards HIV19. However, these differences were likely due to the significant methodological heterogeneity in the studies reflecting in the variability of the operational definitions of knowledge of HIV.
In the present study, several individual and household factors were associated with the knowledge and attitude towards HIV. Male gender, increasing age, higher level of education, employment status, frequency of reading newspapers and watching television contributed towards good comprehensive knowledge and a positive attitude. These findings corroborate the evidence from previous studies conducted in Ethiopia14, Indonesia24 and Lebanon25.
In this study, respondents aged 15–29 years had reduced knowledge of HIV/AIDS compared to respondents aged 30–39 years. Consequently, adolescent and youth represent a vulnerable age group due to their propensity for engagement in high-risk sexual behavior and reduced knowledge of HIV/AIDS that precludes risk mitigation through adoption of adequate protection and safe behaviors. These findings are supported by the results of a KAP study conducted in Maharashtra, India26. Lack of access to correct information sources and suboptimal school based HIV/AIDS education due to a lack of skilled teachers are possible reasons for low awareness of HIV/AIDS in this vulnerable age group27,28.
Women have a higher risk of transmission of HIV during unsafe sexual encounters. The evidence from the present study also suggests that women in India also have lower awareness of HIV compared to men due probably to restricted access to information during education and work, and ineffective social communication with family and peers relating to sexual issues, which precludes opportunities to become aware of sexual transmitted infections and how to protect themselves14.
Respondents from the Christian community, a small religious minority, had better knowledge about HIV/AIDS in this study probably because of their higher concentration in North-Eastern India, a region also having a higher prevalence of HIV. This suggests the successful role of the local administration, sociocultural, and religious organizations in promoting HIV education in their communities29.
In this study, the proportion of respondents in the upper wealth quintile having comprehensive knowledge of HIV/AIDS was greater while those with positive attitude towards HIV was less compared to the other (lower) wealth quintiles. Similar findings were also reported by studies in Ethiopia and Indonesia14,24,30. Previous evidence indicates that HIV/AIDS in the general population is frequently linked to individuals and communities having both reduced awareness and propensity to engage in risky behavior31. Our results suggest that more than half of the respondents still had misconceptions related to HIV transmission and perceived stigma associated with the disease.
Urban respondents also had improved knowledge towards HIV than the rural population, suggestive of better access to health-related information including that from mass media such as television and newspapers, which are known to improve HIV related awareness in developing countries32,33.
The DHS study in Ethiopia, a high-burden HIV country, also observed this rural–urban differential due to improved accessibility to HIV/AIDS prevention and the more frequent control interventions including testing and counselling campaigns in urban areas14. Nevertheless, in this study, the attitude towards HIV was similar in both urban and rural areas suggestive of reduction in stigma towards the disease even in those communities which were otherwise lacking comprehensive knowledge of HIV.
One of the main objectives of NACP phase-V is to overcome the stigma and discrimination around HIV/ AIDS by strengthening evidence based and innovative information, education, communication (IEC) and behavioral change communication (BCC) campaigns for adolescent sex education, social protection schemes focusing on high-risk groups with mix-model campaigns11. Consequently, these initiatives need extensive monitoring and effective implementation throughout the country especially in the high burden areas including the North-Eastern and Southern states. In addition, study findings highlight the need for community-level HIV prevention programs in communities that encounter adverse social determinants particularly related to education and low socioeconomic status.
Strengths and limitations
This study has certain limitations. First, the NFHS is a cross-sectional study, which restricts the analysis to only finding associations, and therefore, causality could not be determined. Second, in this study, information on high-risk groups such as men having sex with men, female sex workers, and injectable drug users were not collected, which signifies a major limitation. Although, the NFHS-5 has an excellent overall response rate of 98%, some non-response in case of high-risk groups cannot be ruled out. Third, the data were self-reported which could have introduced certain recall and social desirability bias. The possibility of some sampling variability in NFHS-4 and NFHS-5 should also be considered.
The strengths of this study were the large sample size with national representativeness achieved through randomized multi-stage sampling. The knowledge of HIV/AIDS ascertained was through multiple questions that captured understanding of respondents on domains related to disease etiology, transmission, and protection.
CONCLUSIONS
Nearly three in four young and middle-aged Indians have persistent lack of comprehensive knowledge of HIV which increases their risk of infection, a situation which has worsened in a 5-year period. Regional and sociodemographic disparities contributed to differences in the level of knowledge that did not necessarily correlate with having positive attitude and associated reduction in HIV related stigma. Consequently, strengthening HIV related IEC and BCC services through both traditional and social media to reach the hitherto unreached populations at risk particularly those living in rural areas, of low SES, and high-burden regions in India, are highly warranted.