
INTRODUCTION
Globally, 31% of all deaths have been attributed to cardiovascular diseases (CVDs) in 2016, mainly because of heart attacks and stroke1. In persons aged ≥50 years in 2019, ischemic heart disease and stroke caused major disability-adjusted life years (DALYs)2. More than three-quarters of deaths from CVDs occur in low- and middle-income countries1. CVDs contributed to 40.0 of mortality in 2008 in Marshall Islands3. Population-based studies among adults in Marshall Islands showed that the prevalence of overweight/obesity was 62.5% and the prevalence of diabetes was 19.6%4. Noncommunicable disease (NCD) risk factors are on the rise in the Marshall Islands, including physical inactivity, inadequate fruit/vegetable intake, high dietary salt, high tobacco use, and high alcohol consumption5. These NCD risk factors often cluster together, increasing the risk of developing CVDs, and should be prioritized in the prevention of CVDs6,7. Key strategies to reduce risk factors of CVDs in the Marshall Islands include tobacco free initiative, nutrition (food safety and salt reduction), physical activity, and Implementation of Package of Essential NCD (PEN) Services5.
In an effort to prevent the development of CVDs, the American Heart Association (AHA) developed the concept of ‘ideal cardiovascular health (CVH)’, including seven metrics to ascertain ideal health behaviors and factors: smoking, body mass index, nutritional intake, physical activity, blood pressure, blood glucose level, and total cholesterol level8,9. Using these seven metrics, the population cardiovascular health status can be defined as ideal (5–7 ideal metrics), intermediate (3–4 ideal metrics) or poor (0–2 ideal metrics)10. Having a higher number of ideal CVH metrics has been shown to be protective against morbidity and mortality11. To our knowledge, there are no national data on CVH in Pacific Island countries, such as the Marshall Islands, an upper middle-income country.
Globally, mainly in high-income countries, 32.2% of participants had overall poor (0–2 ideal metrics) and 19.6% ideal (5–7 ideal metrics) CVH10. Supplementary file Table 1 shows two different classifications of ideal CVH.
Fewer studies have been conducted on CVH in East Asian, Southern Asian and Pacific low- and middle-income countries. Several studies in China found that: 0.05% of people Shandong (aged 18–69 years) had all 7 ideal metrics12; in rural Northwest China (people aged 20–80 years) 0.0% had all 7 ideal metrics, 18.0% had intermediate (no poor CVH metrics and at least one intermediate), and 82% poor (any poor CVH metric)13; in rural Northeast China (people aged ≥35 years) there was 0.1% prevalence of 7 ideal CVH, 11.7% intermediate CVH (at least one health metric at intermediate level, but no poor health metrics), and 88.2% poor CVH (at least one of seven health metrics at poor level)14; and in a nationally representative sample in China (people aged ≥20 years), 33.0% had 5–7 ideal CVH15. In South Asia, in Nepal (people aged 15–69 years), 51.6% had 5–7 ideal CVH metrics16, in semi-urban Western Nepal (people aged ≥25 years), 14.3% had 6 or 7 ideal metrics7, and in urban India (people aged 20–75 years), <0.1% had 7 ideal metrics and 7.1% had ≥6 ideal metrics17. Globally, smoking had the highest prevalence of ideal CVH status (69.1%), followed by fasting blood glucose (FBG) (67.7%), total cholesterol (TC) (51.7%), physical activity (40.6%), body mass index (BMI) (40.3%), blood pressure (BP) (34.6%), and dietary pattern (12.1%)10.
Sociodemographic factors associated with ideal CVH may include female sex10,16,18, younger age10,13,16,18,19, ethnicity18, higher education12,18,19, higher income12,18, lower income19, rural residence20,21, and geographical region22. This study aimed to estimate the prevalence, distribution, and correlates of ideal CVH among adults in the Marshall Islands in 2017.
METHODS
Study design and participants
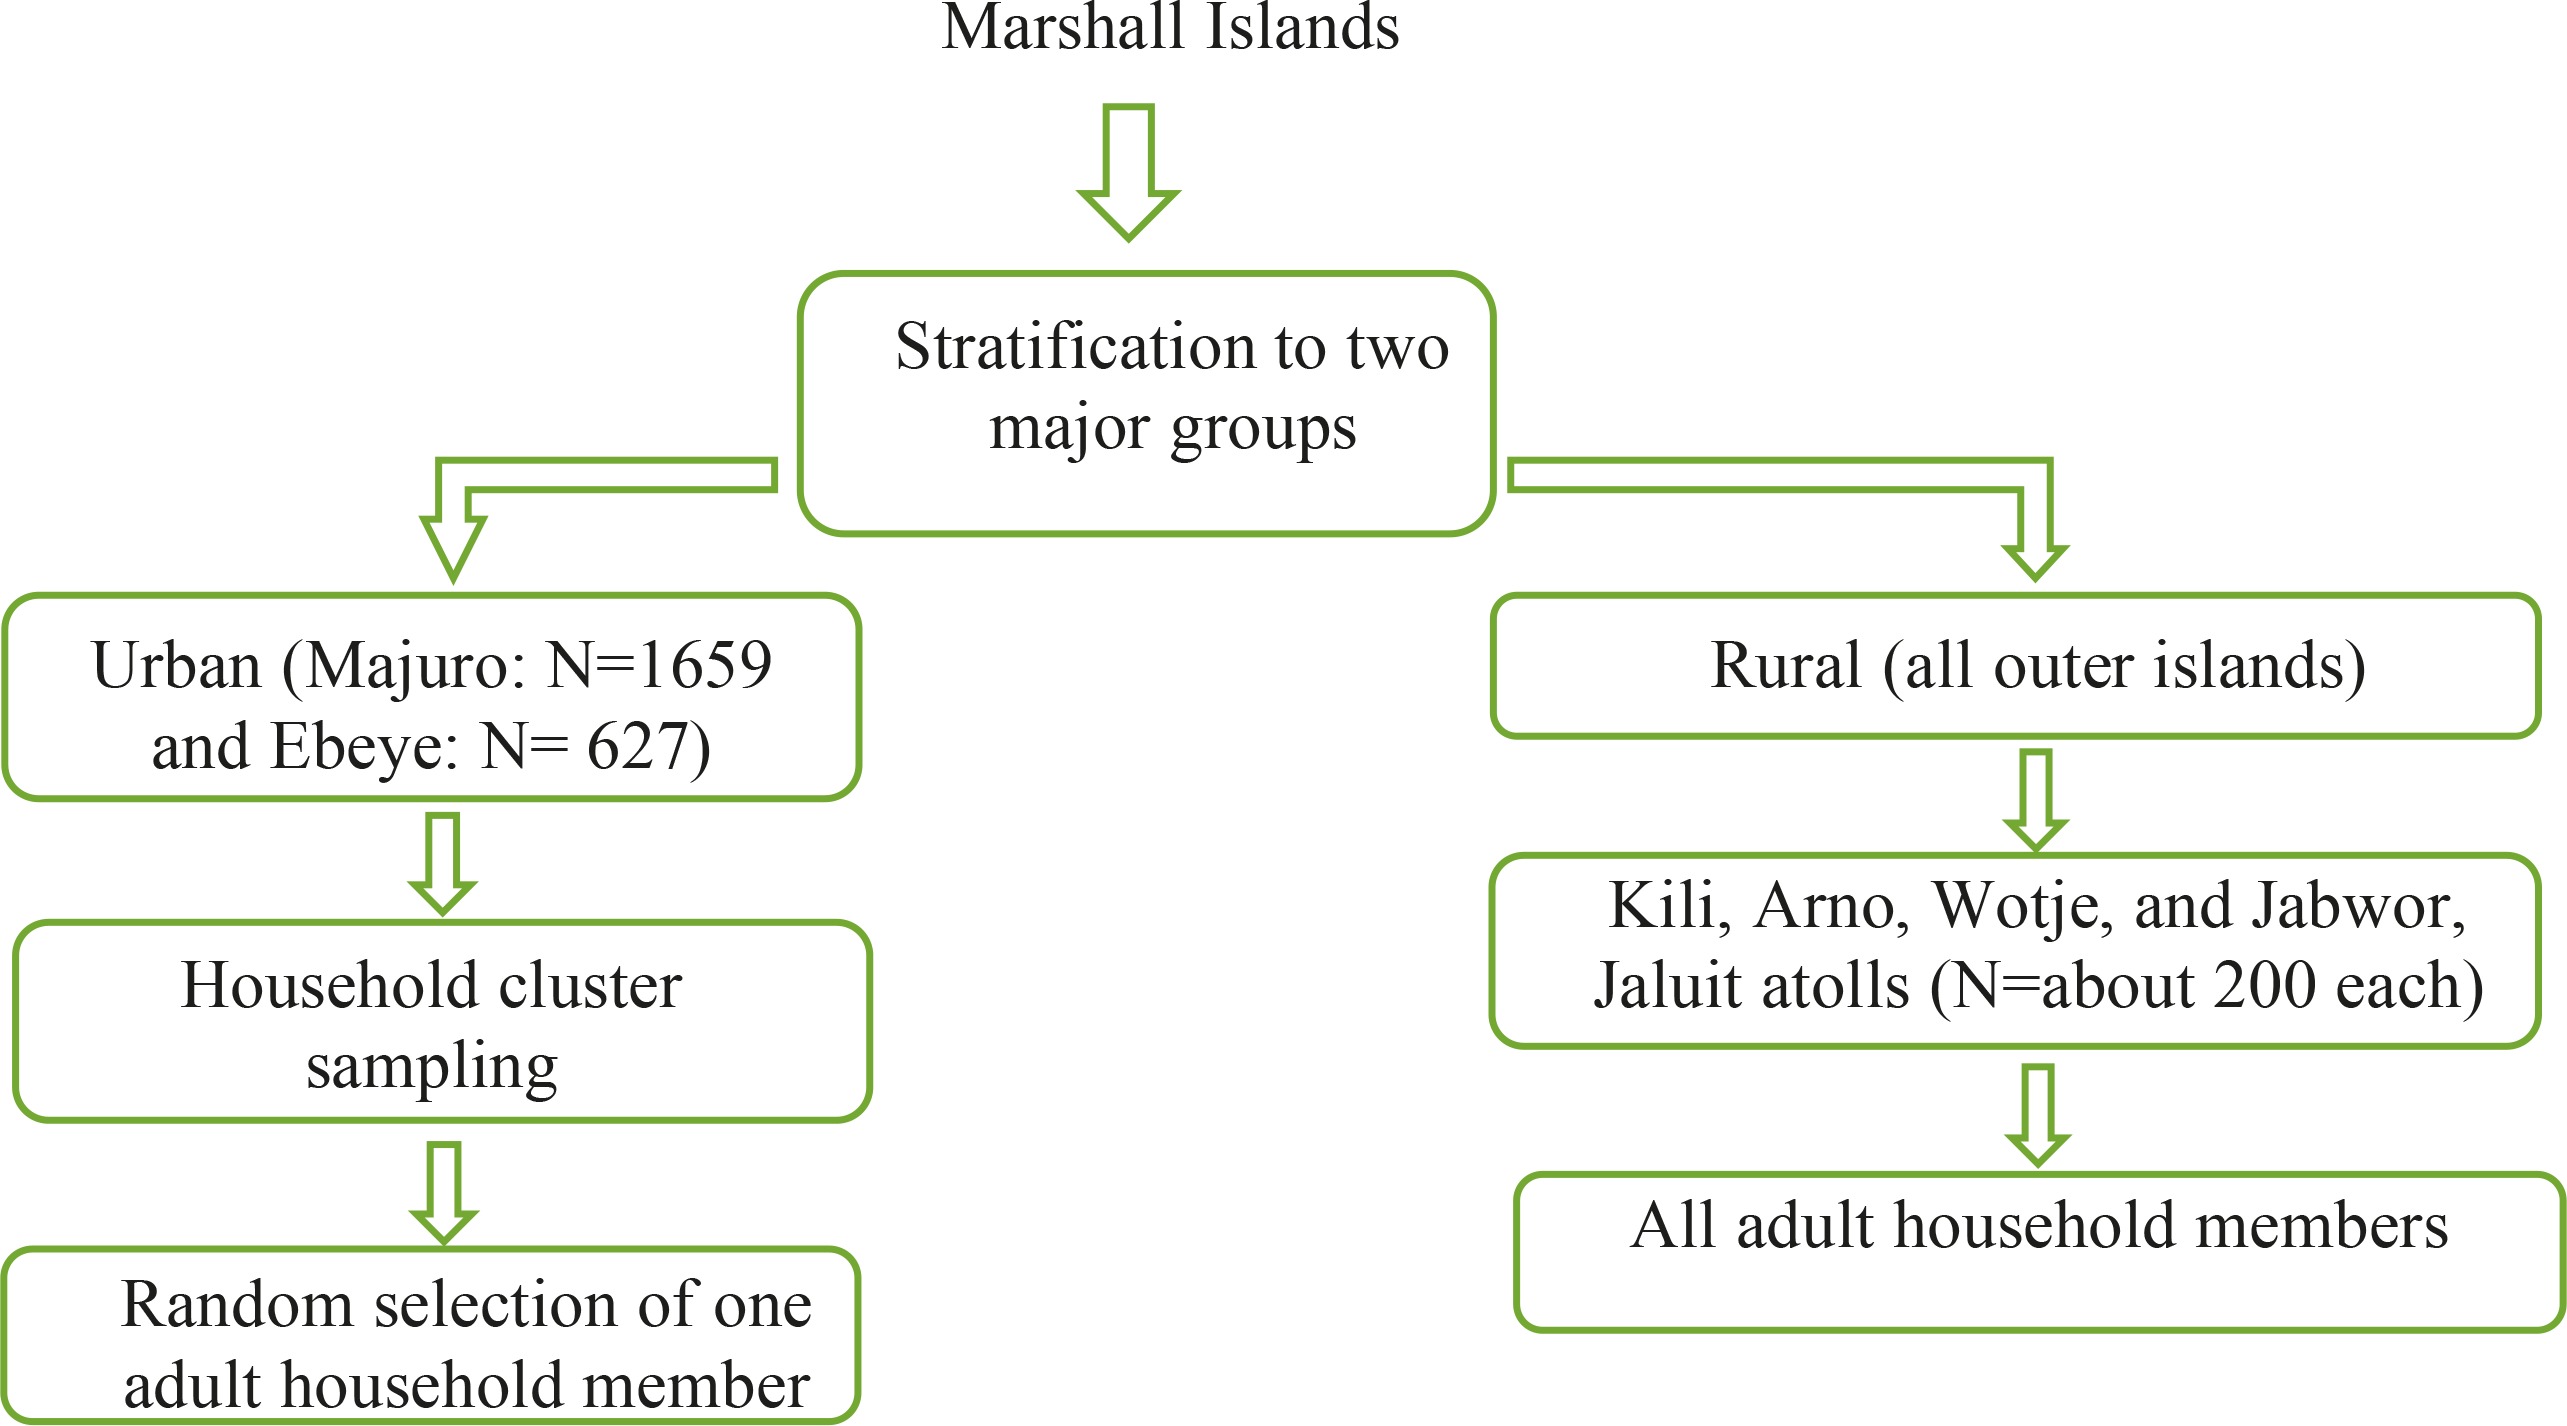
Secondary data were utilized from the ‘STEPwise approach to Surveillance’ (STEPS) cross-sectional survey in the Marshall Islands in 2017–201823. People aged ≥18 years took part in the study that used a multistage sampling design (Figure 1). In the urban islands household cluster sampling was used to randomly select one adult household member and in the rural or outer islands all adult household members were included24. Survey inclusion criteria were: being a Marshall Islands resident, aged ≥18 years, able to comprehend English or Marshallese, and provision of consent24. Trained surveyors conducted structured interviews, as well as physical and biochemical measurements24. The inclusion criteria for the present analysis were participants with no missing data on smoking status, BMI, PA, diet, total TC, FBG, and BP measurements. From the total sample of 3029 adults, 2688 participants with full required information were included. Comparing participants with complete AHA metrics data with participants with incomplete AHA metrics data, older and male participants had significantly more missing AHA metrics data than younger and female participants, while there were no significant differences for (in)complete AHA metrics data regarding education level, household income, work status and ethnicity (Supplementary file Table 2). The Marshall Islands Ministry of Health and Human Services approved the study protocol, and written informed consent was obtained from the participants24.
Data collection followed the WHO three STEPS methodology. Step 1: structured questionnaire administration (sociodemographics, medical history, medication use, and health risk behavior); step 2: blood pressure and anthropometric measurements; and step 3: biochemical tests (blood glucose and blood lipids)23. Anthropometric measurements were taken with a portable electronic weighing scale and measuring inflexible bars24. Of the three blood pressure measurements using digital BP machines (Omron M4-I), the last two readings were averaged24. For glucose and triglycerides (TC), finger blood samples for biochemistry tests were taken, providing that instructions for fasting overnight were followed, and fasting blood glucose (FBG) and TC were measured using CardioChek23.
Measures
Poor, intermediate and ideal CVH levels for smoking, BMI, PA, diet, TC, BP, and FBG were determined, based on modified AHA definitions8,9 for adults aged ≥18 years.
Cardiovascular health behavior
Smoking status
Smoking status is defined as poor if a current smoker (in the past 12 months), and ideal if self-report of not being a past 12-month (current) smoker25.
Body mass index (kg/m2)
BMI is defined as poor for a value ≥30, intermediate for 25.0–29.9, and ideal for <25.
Healthy diet
Poor healthy diet is defined as <2 servings of fruit and vegetables (FV)/day, intermediate as 2 to <4.5 FV/day, and an ideal diet as ≥4.5 FV servings/day25.
Physical activity (PA)
Number of days of physical activity were ascertained by the question: ‘During the past 30 days, other than your regular job, on how many days did you participate in any physical activities or exercises such as running, sports, walking, or going to the gym, specifically for exercise?’. The physical activity was then defined as: poor=0 days/month, intermediate=1–29 days/month, and ideal=30 days/month24.
Cardiovascular health factors
Total cholesterol (TC)
TC is classified as poor for TC ≥6.3 mmol/L (≥240 mg/dL), intermediate for 5.2–6.2 mmol/L (200–239 mg/dL) or treated for TC <5.2 mmol/L (<200 mg/dL), and ideal for <200 mg/dL and without any cholesterol-lowering medication.
Fasting blood glucose (FBG)
FBG is defined as poor for glucose ≥ 7.0 mmol/L (≥126 mg/dL), intermediate for 5.6–6.9 mmol/L (100–125 mg/dL) or treated for <100 mg/dL, and ideal for <5.6 mmol/L (<100 mg/dL) and without any glucose-lowering medication.
Blood pressure (BP)
BP is defined as poor for systolic/diastolic pressures ≥140/≥90 mmHg, intermediate for 120–139 /80–89 mmHg or treated for <120/<80 mmHg, and ideal for <120/<80 mmHg and without any antihypertensive medication.
The seven CVH items were dichotomized as 1=ideal and 0=not ideal, and grouped into 0–2, 3–4, and 5–7 ideal CVH metrics; 5–7 ideal metrics includes the absence of any previous CVD. Furthermore, three additional CVH categories were created as follows: 1) ideal CVH is all seven health metrics at ideal levels in the absence of any previous CVD; 2) intermediate CVH is at least one health metric at the intermediate level, but no poor CVH metrics; and 3) poor CVH is at least one of seven CVH metrics at poor level8,9,26. Ideal health behavior was defined as the simultaneous presence of 4 ideal health behaviors (adequate PA, nonsmoker, normal BMI, and healthy diet) and ideal health factors as the simultaneous presence of 4 ideal health factors (non-smokers, normal BP, normal FBG, and normal TC)8,9,26.
History of CVDs included self-reported coronary heart disease: angina, also called angina pectoris; a heart attack (also called myocardial infarction); stroke; and any kind of heart condition, or other heart disease (yes/no responses)23.
Sociodemographic covariates included age (years), sex (male, female), past year household income (US$: <5000, 5000–9999, 10000–14999, 15000–19999, and ≥20000), education level (none, primary school/elementary completed, middle school completed, high school completed, vocational or technical training school completed, college or university completed), ethnicity (Marshallese, other), and work status (government employee, non-government employee, self-employed, non-paid, retired, student, homemaker, unemployed–able to work, unemployed–unable to work)23.
Statistical analysis
All statistical analyses were conducted with STATA software version 14.0 (Stata Corporation, College Station, TX, USA). Descriptive statistics were used to describe CVH metrics across ideal, intermediate, and poor CVH. Chi-squared tests were applied for assessing differences in proportions and Student’s t-test for differences in means. Unadjusted and adjusted logistic regressions were used to assess the associations between sociodemographic factors and meeting 5–7 CVH metrics, overall and stratified by sex. Covariates in the multivariable logistic regression models were age, sex, education level, household income, work status, and ethnicity. A p<0.05 was accepted as significant, and missing values were excluded from the analysis.
RESULTS
Sample characteristics
The sample included 2688 adults, aged ≥18 years with a median age of 37 years (IQR: 29–49), of which 46.7% were male. Majority (74.2%) had high school or higher education level, 51.0% were employed, 38.1% had a household income <US$10000, and 97.3% were of Marshallese ethnicity. The mean BMI of the respondents was 30.0 kg/m2, the mean systolic BP was 120.4 mmHg, the mean FBG was 133.2 mg/dL, and the prevalence of self-reported CVD was 4.2%. Compared to men, women had a lower education level, lower employment status, lower household income, more likely to be Marshallese, lower systolic BP, and having a higher mean BMI (Table 1).
Table 1
Sample characteristics of participants aged ≥18 years, Marshall Islands, 2017 (N=2688)
| Variables | Total (n=2688) | Men (n=1255; 46.7%) | Women (n=1433; 53.3%) |
|---|---|---|---|
| Sociodemographic | % | % | % |
| Age (years) | |||
| 18–29 | 27.7 | 27.2 | 28.1* |
| 30–49 | 49.1 | 47.0 | 50.9 |
| ≥50 | 23.2 | 25.8 | 20.9 |
| Education level | |||
| <High school | 25.7 | 24.4 | 26.9* |
| High school | 55.9 | 54.5 | 57.2 |
| >High school | 18.3 | 27.1 | 15.9 |
| Past year household income (US$) | |||
| <10000 | 38.1 | 41.4 | 35.2* |
| ≥10000 | 16.4 | 20.2 | 13.0 |
| Do not know/refused to answer | 45.5 | 38.4 | 51.8 |
| Work status | |||
| Employed | 51.0 | 67.0 | 36.9* |
| Unemployed | 22.3 | 19.0 | 29.1 |
| Othera | 26.8 | 14.0 | 38.0 |
| Ethnicity | |||
| Marshallese | 97.3 | 96.4 | 98.0* |
| Otherb | 2.7 | 3.6 | 2.0 |
| Medical | % | % | % |
| Self-reported cardiovascular disease | 4.2 | 4.2 | 4.1 |
| Use of anti-hypertensive drug | 0.4 | 0.6 | 0.3 |
| Use of hypoglycemic drug | 0.4 | 0.6 | 0.3 |
| Use of lipid-lowering drug | 0.2 | 0.3 | 0.1 |
| Measurements | Mean (SD) | Mean (SD) | Mean (SD) |
| Systolic blood pressure (mmHg) | 120.4 (19.7) | 124.4 (18.3) | 116.9 (20.2)* |
| Body mass index (kg/m2) | 30.0 (8.3) | 28.8 (8.1) | 31.1 (8.4)* |
| Total cholesterol (mg/dL) | 165.0 (106.1) | 162.8 (124.4) | 166.9 (87.0) |
| Fasting blood glucose (mg/dL) | 133.2 (121.3) | 135.7 (137.9) | 131.0 (104.7) |
Distribution of cardiovascular health metrics
Approximately, 75.9% of Marshall Islands adults reported that they did not smoke (54.8% in men and 94.3% in women). About one in four participants (26.4%) had ideal BMI (31.6% in men and 21.9% in women), and 35.4% had ideal physical activity (41.8% in men and 29.8% in women). A low proportion of healthy diet (≥4.5 servings of fruit and vegetables/day) of 6.4% was reported (5.3% among men and 7.5% among women). Most Marshall Islands adults had ideal total cholesterol (84.9%) and fasting glucose levels (69.4%), while only 46.7% had ideal blood pressure. More women than men had ideal smoking, ideal diet, and ideal blood pressure, while men had significantly higher ideal BMI, PA, and TC, than women. Almost one in ten (24.8%) of respondents had poor CVH (0–2 ideal metrics), 55.9% intermediate CVH (3–4 ideal metrics), and 19.4% ideal CVH (5–7 ideal metrics). Only 0.2% had ideal CVH (all 7 metrics), 26.6% intermediate CVH (≥1 metric in the intermediate category and none in the poor category), and 73.2% had poor CVH (≥1 metric in poor category). Women had better CVH metrics than men in the two measures (Table 2).
Table 2
Cardiovascular health (CVH) metrics distribution
| Health metrics component | Metrics level | Total (n=2688) % | Men (n=1255) % | Women (n=1433) % | Chi-squared p |
|---|---|---|---|---|---|
| Smoking | Poor | 24.1 | 45.2 | 5.7 | <0.001 |
| Intermediate | - | - | - | ||
| Ideal | 75.9 | 54.8 | 94.3 | ||
| Body mass index | Poor | 45.3 | 35.3 | 54.0 | <0.001 |
| Intermediate | 28.3 | 33.1 | 24.1 | ||
| Ideal | 26.4 | 31.6 | 21.9 | ||
| Diet | Poor | 80.4 | 80.9 | 80.0 | 0.048 |
| Intermediate | 13.1 | 13.9 | 12.5 | ||
| Ideal | 6.4 | 5.3 | 7.5 | ||
| Physical activity | Poor | 33.6 | 24.6 | 41.5 | <0.001 |
| Intermediate | 31.0 | 33.5 | 28.8 | ||
| Ideal | 35.4 | 41.8 | 29.8 | ||
| Total cholesterol | Poor | 5.8 | 4.5 | 7.0 | <0.001 |
| Intermediate | 9.2 | 7.1 | 11.1 | ||
| Ideal | 84.9 | 88.4 | 81.9 | ||
| Blood pressure | Poor | 18.6 | 20.2 | 17.2 | <0.001 |
| Intermediate | 34.7 | 42.5 | 27.8 | ||
| Ideal | 46.7 | 37.3 | 55.0 | ||
| Fasting blood glucose | Poor | 26.8 | 26.1 | 27.4 | 0.690 |
| Intermediate | 3.8 | 3.7 | 3.9 | ||
| Ideal | 69.4 | 70.2 | 68.7 | ||
| CVH | |||||
| Poor (0–2 ideal metrics) | 24.8 | 28.6 | 21.4 | <0.001 | |
| Intermediate (3–4 ideal metrics) | 55.9 | 55.1 | 56.6 | ||
| Ideal (5–7 metrics) | 19.4 | 16.3 | 22.1 | ||
| Ideala | 0.2 | 0.1 | 0.3 | <0.001 | |
| Intermediateb | 26.6 | 22.8 | 30.0 | ||
| Poorc | 73.2 | 77.1 | 69.8 | ||
Proportion of ideal cardiovascular health metrics
In all, 0.6% had zero, 4.4% one, 16.6% two, 30.7% three, 27.6% four, 15.7% five, 4.2% six, and 0.2% all seven, ideal CVH metrics (Table 3). A total of 24.9% participants were ideal on all 4 health factors, but only 0.4% were ideal on all 4 health behaviors, the proportion of all 4 health factors was significantly higher among women (35.3%) than men (13.2%) (p<0.001) but were similar between the sexes for all 4 health behaviors (0.6% among women and 0.3% among men) (p>0.05).
Table 3
Distribution of ideal cardiovascular health (CVH) metrics in percent among participants (N=2688)
Associations with meeting 5–7 ideal CVH metrics
In adjusted logistic regression analysis, older age (30–49 years and ≥50 years) (AOR=0.41; 95% CI: 0.32–0.51, and AOR=0.20; 95% CI: 0.15–0.29, respectively) and male sex (AOR=0.72; 95% CI: 0.58–0.89) were negatively associated with meeting 5–7 ideal CVH metrics. In addition, in unadjusted analysis, higher education level, not knowing their household income, unemployed, and home maker, student, retired or non-paid work status, were positively associated with meeting 5–7 ideal CVH metrics. Similar results were found for gender stratified analyses (Tables 4 and 5).
Table 4
Associations with meeting 5–7 ideal cardiovascular health metrics for both sexes
| Variables | OR (95% CI) | p | AOR (95% CI)* | p |
|---|---|---|---|---|
| Age (years) | ||||
| 18–29 (Ref.) | 1 | 1 | ||
| 30–49 | 0.37 (0.30–0.46) | <0.001 | 0.41 (0.32–0.51) | <0.001 |
| ≥50 | 0.18 (0.13–0.26) | <0.001 | 0.20 (0.15–0.29) | <0.001 |
| Sex | ||||
| Female (Ref.) | 1 | 1 | ||
| Male | 0.69 (0.56–0.83) | <0.001 | 0.72 (0.58–0.89) | 0.003 |
| Education level | ||||
| <High school (Ref.) | 1 | 1 | ||
| High school | 1.51 (1.18–1.93) | <0.001 | 1.22 (0.93–1.59) | 0.147 |
| >High school | 1.55 (1.15–2.19) | 0.005 | 1.28 (0.91–1.79) | 0.154 |
| Household income (US$) | ||||
| <10000 (Ref.) | 1 | 1 | ||
| ≥10000 | 1.15 (0.86–1.52) | 0.351 | 1.24 (0.91–1.69) | 0.172 |
| Do not know/refused response | 1.30 (1.05–1.61) | 0.019 | 1.01 (0.79–1.27) | 0.963 |
| Work status | ||||
| Employed (Ref.) | 1 | 1 | ||
| Unemployed | 1.55 (1.22–1.98) | <0.001 | 1.21 (0.91–1.61) | 0.198 |
| Other | 1.84 (1.47–2.30) | <0.001 | 1.29 (0.99–1.67) | 0.059 |
| Ethnicity | ||||
| Other (Ref.) | 1 | 1 | ||
| Marshallese | 1.53 (0.77–2.99) | 0.22 | 1.23 (0.61–2.50) | 0.568 |
Table 5
Associations with meeting 5–7 ideal cardiovascular health metrics for men and women separately
| Variables | OR (95% CI) | p | AOR (95% CI)* | p |
|---|---|---|---|---|
| Women | ||||
| Age (years) | ||||
| 18–29 (Ref.) | 1 | 1 | ||
| 30–49 | 0.34 (0.26–0.45) | <0.001 | 0.37 (0.28–0.50) | <0.001 |
| 50–69 | 0.13 (0.08–0.21) | <0.001 | 0.15 (0.09–0.24) | <0.001 |
| Education level | ||||
| <High school (Ref.) | 1 | 1 | ||
| High school | 1.79 (1.30–2.47) | <0.001 | 1.28 (0.90–1.83) | 0.173 |
| >High school | 2.01 (1.34–3.02) | <0.001 | 1.49 (0.94–2.34) | 0.088 |
| Household income (US$) | ||||
| <10000 (Ref.) | 1 | 1 | ||
| ≥10000 | 1.08 (0.72–1.61) | 0.727 | 1.05 (0.68–1.63) | 0.814 |
| Do not know/refused response | 1.14 (0.86–1.50) | 0.374 | 0.93 (0.69–1.26) | 0.635 |
| Work status | ||||
| Employed (Ref.) | 1 | 1 | ||
| Unemployed | 1.35 (0.97–1.87) | 0.076 | 1.24 (0.85–1.81) | 0.263 |
| Other | 1.35 (1.01–1.81) | 0.046 | 1.09 (0.79–1.51) | 0.606 |
| Ethnicity | ||||
| Other (Ref.) | 1 | 1 | ||
| Marshallese | 1.55 (0.51–4.71) | 0.441 | 1.55 (0.51–4.71) | 0.441 |
| Men | ||||
| Age (years) | ||||
| 18–29 (Ref.) | 1 | 1 | ||
| 30–49 | 0.39 (0.28–0.55) | <0.001 | 0.49 (0.34–0.72) | <0.001 |
| 50–69 | 0.27 (0.18–0.43) | <0.001 | 0.28 (0.17–0.45) | <0.001 |
| Education level | ||||
| <High school (Ref.) | 1 | 1 | ||
| High school | 1.20 (0.82–1.75) | 0.35 | 1.02 (0.68–1.52) | 0.94 |
| >High school | 1.19 (0.76–1.88) | 0.451 | 0.90 (0.54–1.50) | 0.686 |
| Household income (US$) | ||||
| <10000 (Ref.) | 1 | 1 | ||
| ≥10000 | 1.31 (0.87–1.97) | 0.2 | 1.54 (0.99–2.40) | 0.057 |
| Do not know/refused response | 1.43 (1.01–2.03) | 0.046 | 1.14 (0.78–1.67) | 0.5 |
| Work status | ||||
| Employed (Ref.) | 1 | 1 | ||
| Unemployed | 1.56 (1.07–2.29) | 0.022 | 1.13 (0.72–1.77) | 0.598 |
| Other | 2.59 (1.76–3.81) | <0.001 | 2.03 (1.28–3.20) | 0.002 |
| Ethnicity | ||||
| Other (Ref.) | 1 | 1 | ||
| Marshallese | 1.02 (0.40–2.59) | 0.962 | 1.02 (0.40–2.59) | 0.962 |
DISCUSSION
The study presents, for the first-time, national data on the prevalence and distribution of CVH metrics in a national sample of adults in the Marshall Islands. The found prevalence of poor CVH (0–2 ideal metrics) (24.8%) and ideal CVH (5–7 ideal metrics) (19.4%), were similar to global estimates, mainly in high-income countries, of poor CVH (having 0–2 ideal metrics) (32.2%) and ideal CVH (having 5–7 ideal metrics) (19.6%)10, but were lower than in China (33.0%, 5–7 ideal metrics)15, and lower than in Nepal (51.6%, 5–7 ideal metrics)16. The proportions of ideal CVH metrics (all 7 metrics) (0.2%), intermediate CVH (≥1 metric in the intermediate category and none in the poor category) (26.6%) and poor CVH (≥1 metric in poor category) (73.2%) in this study, were similar to those in urban India (<0.1% had 7 ideal metrics)17, Shandon in China (0.05% all 7 ideal metrics)12, and those of rural area Northwest China, all 7 ideal metrics (0.0%), intermediate (no poor health metrics and at least one intermediate) (18.0%), and poor (any poor CV health metric) (82%)13. Our findings that the prevalence of ideal CVH is low indicate that significant efforts are needed to promote CVH to prevent CVD in the Marshall Islands.
Similar to the three best global estimates10, this study showed that TC (84.9%), smoking (75.9%), and FGP (69.4%) had the highest prevalence of ideal status, while similar to the poorest global estimates10, healthy diet (6.4%) had the poorest prevalence of ideal status in this study. The estimate of ideal PA (35.4%) in this study is similar to global estimates of PA (40.6%), and the ideal BMI (26.4%) is almost half of the global ideal BMI (40.3%)10. In the 2002 STEPS national survey (aged 15–64 years) in the Marshall Islands, a higher rate of ideal BMI (37.5%) was observed27. The high prevalence of ideal PA (35.4%) in this national study seems to be confirmed in the 2002 STEPS survey in the Marshall Islands (33.9% physically active, ≥600 MET-minutes/week)28. A low ideal healthy diet (fruit and vegetable consumption; 6.4%, <4.5 servings/day) was also found in the 2002 Marshall Islands STEPS survey (9.0%, <5 servings/day)27. The proportions of poor smoking were 45.2% among men and 5.7% among women in this study, which are similar to those in the 2002 Marshall Islands STEPS survey (39.5% among men and 6.0% among women)28. Poor BP (18.6%) was in this study (aged ≥18 years) higher than in the 2002 Marshall Islands STEPS survey (10.5%, hypertension, aged 18–64 years)27. Poor FBG (26.8%) was similar to the 2002 survey (raised fasting blood glucose, capillary whole blood 6.1 mmol/L, or on medication, 29.8%)27, and poor and intermediate TC (15.0%) was lower than in the 2002 survey (21.6% TC ≥5.2 mmol/L)27. Similar to the 2002 Marshall Islands STEPS survey, smoking and raised blood pressure were more frequent in men than in women, while obesity and raised TC occurred more often in women than in men28.
A total of 24.9% participants were ideal on all 4 health factors, but only 0.4% were ideal on all 4 health behaviors; the proportion of all 4 health factors was significantly higher among women (35.3%) than men (13.2%) (p<0.001) but were similar between the sexes for all 4 health behaviors (0.6% among women and 0.3% among men) (p>0.05). Similar to a study in Northwest China13, this study found that the proportion of having all 4 ideal health factors (24.9%) was significantly higher than those with all 4 ideal health behaviors (0.4%). The proportion of ideal CVH health factors was higher in women than in men, while the proportion of all 4 ideal CVH health behaviors did not significantly differ by sex. In a study in rural Uganda, ideal CVH health factors were higher in men than in women and ideal CVH health behaviors were higher in women than in men19. This result may indicate that the promotion of healthy behaviors should be emphasized to improve CVH13. A healthy diet (fruit and vegetable intake) was the least prevalent health metric (6.4%) in this study. Lack of affordability and availability of fruit and vegetables may be an influencing factor for the low intake of FV29. Consequently, a stark increase of the production and consumption of fruit and vegetable, and highlighting the benefits of the behavior through communication and education strategies, are urgently needed to improve CVH in the Marshall Islands28.
Consistent with previous research10,12,13,16,18,19, ideal CVH was higher among younger age groups (aged 8–29 years), among women, and those with higher education level in the unadjusted analysis. The overall better performance of women than men on ideal CVH may be largely explained by their high proportion of ideal smoking and ideal BP compared to men. Therefore, men should be particularly targeted, regarding tobacco and blood pressure control.
To improve CVH in the Marshall Islands, CVH behaviors should be improved through multidisciplinary interventions in individuals, health educators, policy makers, and public health professionals30. Comprehensive interventions may target promotion of body weight control, smoking cessation, healthy diets, and screening and control of high levels of blood sugar and blood pressure7. Study results may inform the NCD policy and plan of action in the Marshall Islands. Some NCD policies and legislation are in place in the Marshall Islands, but there are no policies or legislation on tobacco sales and licensing, tobacco industry interference, alcohol advertising, reduction of population salt consumption, controlling marketing of foods and drinks to children, and physical education in schools, and there is no enforcement of laws and regulations related to NCD risk factors in the Marshall Islands31.
Limitations
Some variables were assessed by self-report, which may have biased responses, and the cross-sectional design precludes causative conclusions between assessed variables. Although 3029 adults participated in the survey, only 88.7% had complete information on all seven CVH metrics. Furthermore, we included only one healthy diet component (fruit and vegetable consumption) and not the original 5 components of the AHA healthy diet (≥4.5 cups/day fruits and vegetables, ≥3.5 ounce servings/week of fish, <1500 mg/day sodium, <450 calo¬ries/week of sweets/sugar, and ≥3 1-ounce servings/day whole grains)8,9. In addition, the physical activity definition was only based on one question on the frequency physical activity/exercise, not directly meeting the AHA definitions of: ‘poor=none; intermediate=1–149 min/week, moderate intensity or 1–74 min/week vigorous intensity or 1–149 min/week moderate + vigorous; and ideal= ≥150 min/week moderate intensity or ≥75 min/week vigorous intensity or ≥150 min/week moderate + vigorous8,9.
CONCLUSIONS
The proportion of 5–7 ideal CVH metrics was low in Marshall Islands adults. Both primary and secondary prevention programs should be implemented to improve CVH in the Marshall Islands. The study found several factors associated with ideal CVH, which can be utilized in public health interventions. Future research may want to include more comprehensive measures on physical activity and healthy diet.