INTRODUCTION
More preventable deaths in the United States result from tobacco consumption than any other cause, and the emergence of new tobacco products, such as e-cigarettes, has altered the ways in which youth select to experiment with and use tobacco1-3. Research suggests that e-cigarette experimentation among youth leads to established cigarette smoking4-8, and approximately 90% of adult tobacco users had tried a tobacco product before the age of 18 years9. Such a transition is alarming in that the health consequences of established tobacco use include not only nicotine dependence but also risk of chronic cardiovascular and respiratory illnesses as well as a host of other health problems1. Understanding the ways in which youth initiate and use tobacco is imperative to decrease tobacco-associated death and disease.
In 2019, two-fifths of US middle and high school students (40.5%) were tobacco users (ever and past-month users), and the most commonly used product was e-cigarettes3. Tobacco uptake may be influenced by communication channel use, such as receiving or sharing information about tobacco with friends and family or via digital media3,10,11. However, communication channels vary from intimate communication among peers to mediated messaging to large audiences. More recently, social and digital media have created new communication landscapes, capable of being tailored to particular audiences and less regulated than traditional media, offering innovative paths for the tobacco industry to target specific populations for tobacco promotion while evading tobacco control policies12.
Tobacco promotion is strongly linked to tobacco initiation and use among youth13. National Youth Tobacco Survey (NYTS) findings indicate that 81.7% of middle and high school students reported exposure to tobacco product marketing, with 69.3% indicating that such marketing focused on e-cigarettes3. Exposure to tobacco-related information is associated with tobacco use; for example, e-cigarette advertising, via sources such as television, posters or billboards, social media, and print media, is associated with ever and current e-cigarette use14. Further, an analysis examining Twitter activity and tobacco use found that youth who tweet positive-tobacco messages had higher odds of tobacco use15. Social media platforms also can be employed by tobacco companies to communicate positive messages, such as product advertisements, about tobacco to youth16. Given the popularity of social media among youth, it is not surprising that many are exposed to tobacco-related information via these platforms. For example, one investigation found that about 1 in every 2 Texas middle or high schoolers is exposed to tobacco-related information on social media17. Beyond exposure to tobaccorelated marketing and advertising, recent evidence suggests conversations with friends and family are influential in youth decisions to use e-cigarettes18. Given that youth are likely to receive and share tobacco-related information using multiple communication channels, additional inquiry is needed to better understand potential sociodemographic differences and how such differences may contribute to disparities in tobacco use.
Patterns of tobacco use among US youth vary by sex19. For example, tobacco use, including use of cigarettes, cigars, smokeless tobacco, pipe tobacco, and e-cigarettes, is more common among male high schoolers than female high schoolers19. However, among middle school youth, only use of smokeless tobacco is higher among males than females19. Given the sex differences in youth tobacco consumption, understanding variation in where male and female youth receive and share tobacco-related information is important. For example, female youth aged 12–17 years are less susceptible to use of cigarettes or chewing tobacco after exposure to tobacco promotions, compared to male youth20. Additionally, female youth, compared to male youth, had lower odds of ever and past-month e-cigarette use for each additional exposure to e-cigarette marketing of various digital and print media sources14. Although links between exposure to marketing and advertising and tobacco uptake among youth have been documented, examinations of potential differences in these associations by key sociodemographic factors and groups are comparatively sparse. For example, studies focusing on vulnerable youth populations, such as Appalachian youth, are needed.
Many Appalachian youth are susceptible to tobacco uptake and use, and several factors may contribute to this susceptibility21-23. For example, living in poverty is associated with tobacco use24, and several Appalachian states have high poverty rates25. Overall, the poverty rate in Appalachia is estimated to be 16.3% versus 14.6% nationally21. Additionally, cultural and historical influences, ranging from family tobacco farms to community traditions, are contributing factors to tobacco use in this region22. Although Appalachia ranks high in both poverty and tobacco use, little is known about the ways in which Appalachian youth receive and share tobacco-related information.
The present study examined sex differences and their influence on associations between receiving and sharing tobacco-related information and tobacco use. The specific aims of this study were: 1) to examine sex differences in the distribution of communication channels through which Appalachian youth receive and share tobacco-related information by tobacco use, and 2) to assess the moderating effect of sex on associations between receiving and sharing tobacco-related information through each communication channel and tobacco use.
METHODS
Study design
This study used data from the Youth Appalachian Tobacco Study (YATS) conducted between fall 2014 and spring 2016. YATS addressed perceptions of tobacco products, tobaccorelated communication, and tobacco use among middle and high school students living in counties in the Appalachian regions of three states—Kentucky, North Carolina, and New York. After obtaining approval from the university’s Institutional Review Board, a letter was sent to parents detailing the study and explaining their ability to decline their child’s participation. Prior to data collection, students were provided assent forms and could elect to decline participation. Data collection took place during the regular school day.
Participants
YATS included 1280 participants. This analysis focused on youth who used cigarettes, smokeless tobacco, and e-cigarettes and who indicated receiving and sharing tobacco-related information via six communication channels. Participants with missing tobacco information (n=94) and communication channel information (n=65) were excluded. Additionally, participants with missing data on potential confounders (i.e. sex, race/ethnicity, school grade, state, number of hours per week spent on smartphones, number of household tobacco users, ranked self-esteem) (n=83) were also excluded. The resulting analytic sample size was 1038.
Measures
Tobacco use was defined by participants’ responses to questions about ever and current (past-month) use of cigarettes, smokeless tobacco, and e-cigarettes. For this analysis, participants who indicated ever or current use of any product were classified as tobacco users. Participants who did not indicate such use were classified as never users.
Using a five-point scale (1=Strongly Disagree; 2=Disagree; 3=Neither Disagree nor Agree; 4=Agree; 5=Strongly Agree), participants indicated whether they received or shared tobacco-related information via specific communication channels. Responses were dichotomized—disagreement (responses 1–3) and agreement (responses 4–5). A total of 14 types of tobacco-related communication were considered (i.e. six for receiving conventional tobacco-related information, six for receiving e-cigarette-related information, one for sharing conventional tobacco-related information, and one for sharing e-cigarette-related information). Participants indicated their level of agreement or disagreement regarding receiving conventional tobacco-related information from: 1) ‘talking with people I know, such as friends and family’ (FF); 2) ‘programs in which I participate, such as youth, school or community groups’ (YSCG); 3) ‘broadcast media like television and radio’ (BRO); 4) ‘print media like pamphlets, flyers, and posters’ (PRI); 5) ‘public displays, such as billboards’ (PUB); and 6) ‘digital media like blogs or social media’ (DIG). They also indicated their level of agreement or disagreement regarding receiving e-cigarette-related information for each of these six channels. The following is an example from this section of the questionnaire: ‘I get information about electronic cigarettes from programs in which I participate, such as youth, school or community groups’. Additionally, participants indicated their level of agreement regarding sharing conventional tobacco-related with FF as well as sharing e-cigarette-related information with FF.
Covariates
Participant characteristics included sex, age, race/ethnicity, school type, state, number of hours per week spent on smartphones, number of household tobacco users, and ranked self-esteem. Sex was defined based on whether participants identified as male or female. Age was treated as a continuous variable. Race/ethnicity was classified as White/Caucasian, Black/African American, Hispanic, Asian, other, and two or more. For this analysis, this variable was dichotomized into White/Caucasian and Non-White/ Non-Caucasian. School type was classified as middle school or high school. State was categorized as Kentucky, North Carolina, or New York. Number of hours per week spent on smartphones consisted of seven categories: 0 (no smartphone), <5, 5–9, 10–19, 20–29, 30–39, and ≥40. Based on the median of its distribution, this variable was dichotomized: <20 and ≥20 hours per week. Number of household tobacco users was categorized as: 0 or ≥1. Selfesteem was assessed via the question: ‘How strongly do you agree with the following statement: I have high self-esteem (self-esteem=confidence or feeling good about yourself)’. Responses, which were based on a five-point scale, were dichotomized as low/uncertain (responses 1–3) and high (responses 4–5).
Statistical analysis
Distributions of overall participant characteristics and by tobacco use were examined. Differences in distributions of participant characteristics by tobacco use were evaluated using chi-squared tests of independence for categorical covariates and Student’s t-tests for continuous covariates. Participant characteristics were also analyzed after stratification by sex. Where necessary, chi-squared tests of independence and Student’s t-tests evaluated differences in distributions of tobacco use by sex (male vs female) for each characteristic. In addition, distributions of each communication channel were examined overall and by sex and tobacco use. Differences in distributions were computed using chi-squared tests of independence.
Crude and adjusted logistic regression models were used to assess associations between each communication channel and tobacco use; reference groups were disagree (exposure) and never use (outcome). All models were adjusted for sex, race/ethnicity, school type, state, number of hours per week spent on smartphones, number of household tobacco users, and ranked self-esteem. Interaction terms between each communication channel and sex were tested in all adjusted models; only an interaction term between sharing e-cigarette-related information with FF and sex was retained due to statistical significance (Supplementary Table S1). Because race/ethnicity differed by tobacco use in males, we tested an additional interaction term between sex and race/ethnicity in all adjusted models. However, because the interaction term was not associated with the dependent variable in each model (Wald p>0.05), it was excluded to avoid over-adjustment (Supplementary Table S2). Effect modification by sex was evaluated by stratifying each adjusted logistic regression model. Crude odds ratios (OR), adjusted odds ratios and 95% confidence intervals (CIs) are reported. Data were analyzed using SAS 9.4 (Cary, NC).
RESULTS
Participant characteristics
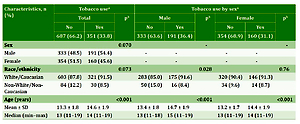
Table 1 presents participant characteristics by overall tobacco use and tobacco use stratified by sex. Approximately two-thirds of the sample were never users (66.2%) and one-third were tobacco users (33.8%). Nearly half of the participants were female (49.5%) and most were White/Caucasian (89.0%). Approximately one-third indicated use of a smartphone for ≥20 hours per week (33.5%), and more than half reported high self-esteem (58.2%). Additionally, over half had one or more household members who used tobacco (57.7%). Tobacco use differed significantly by age, school type, state, number of household tobacco users, ranked self-esteem (p<0.001 for all), and number of hours per week spent on smartphones (p=0.002). Differences by sex and race/ethnicity were not statistically significant (p=0.070 and 0.073, respectively).
Table 1
Participant characteristics by tobacco use and sex (N=1038)
| Characteristics, n (%) | Tobacco usea | Tobacco use by sexa | |||||||
|---|---|---|---|---|---|---|---|---|---|
| Total | pb | Male | pb | Female | pb | ||||
| No | Yes | No | Yes | No | Yes | ||||
| 687 (66.2) | 351 (33.8) | 333 (63.6) | 191 (36.4) | 354 (68.9) | 160 (31.1) | ||||
| Sex | 0.070 | - | - | ||||||
| Male | 333 (48.5) | 191 (54.4) | - | - | - | - | |||
| Female | 354 (51.5) | 160 (45.6) | - | - | - | - | |||
| Race/ethnicity | 0.073 | 0.028 | 0.76 | ||||||
| White/Caucasian | 603 (87.8) | 321 (91.5) | 283 (85.0) | 175 (91.6) | 320 (90.4) | 146 (91.3) | |||
| Non-White/Non-Caucasian | 84 (12.2) | 30 (8.5) | 50 (15.0) | 16 (8.4) | 34 (9.6) | 14 (8.7) | |||
| Age (years) | <0.001 | <0.001 | <0.001 | ||||||
| Mean ± SD | 13.3 ± 1.8 | 14.6 ± 1.9 | 13.4 ± 1.8 | 14.7 ± 1.9 | 13.2 ± 1.7 | 14.4 ± 1.9 | |||
| Median (min–max) | 13 (11–19) | 14 (11–19) | 13 (11–18) | 15 (11–19) | 13 (11–19) | 14 (11–19) | |||
| School type | <0.001 | <0.001 | <0.001 | ||||||
| Middle school | 469 (68.3) | 156 (44.4) | 215 (64.6) | 76 (39.8) | 254 (71.8) | 80 (50.0) | |||
| High school | 218 (31.7) | 195 (55.6) | 118 (35.4) | 115 (60.2) | 100 (28.2) | 80 (50.0) | |||
| School state | <0.001 | <0.001 | 0.008 | ||||||
| Kentucky | 194 (28.2) | 159 (45.3) | 89 (26.7) | 91 (47.6) | 105 (29.7) | 68 (42.5) | |||
| North Carolina | 342 (49.8) | 139 (39.6) | 173 (52.0) | 70 (36.7) | 169 (47.7) | 69 (43.1) | |||
| New York | 151 (22.0) | 53 (15.1) | 71 (21.3) | 30 (15.7) | 80 (22.6) | 23 (14.4) | |||
| Hours per week spent on smartphones | 0.002 | <0.001 | 0.011 | ||||||
| 0 (no smartphone) | 81 (11.8) | 31 (8.8) | 55 (16.6) | 20 (10.5) | 26 (7.3) | 11 (6.9) | |||
| <5 | 138 (20.1) | 48 (13.7) | 79 (23.7) | 34 (17.8) | 59 (16.7) | 14 (8.8) | |||
| 05–9 | 143 (20.8) | 57 (16.2) | 74 (22.2) | 29 (15.2) | 69 (19.5) | 28 (17.5) | |||
| 10–19 | 119 (17.3) | 73 (20.8) | 51 (15.3) | 48 (25.1) | 68 (19.2) | 25 (15.6) | |||
| 20–29 | 81 (11.8) | 45 (12.8) | 34 (10.2) | 21 (11.0) | 47 (13.3) | 24 (15.0) | |||
| 30–39 | 41 (6.0) | 30 (8.6) | 10 (3.0) | 18 (9.4) | 31 (8.8) | 12 (7.5) | |||
| ≥40 | 84 (12.2) | 67 (19.1) | 30 (9.0) | 21 (11.0) | 54 (15.2) | 46 (28.7) | |||
| Number of household tobacco usersc | <0.001 | <0.001 | <0.001 | ||||||
| 0 | 333 (48.5) | 106 (30.2) | 158 (47.5) | 62 (32.5) | 175 (49.4) | 44 (27.5) | |||
| ≥1 | 354 (51.5) | 245 (69.8) | 175 (52.5) | 129 (67.5) | 179 (50.6) | 116 (72.5) | |||
| Ranked self-esteem | <0.001 | <0.001 | <0.001 | ||||||
| Low/uncertain | 252 (36.7) | 182 (51.9) | 87 (26.1) | 78 (40.8) | 165 (46.6) | 104 (65.0) | |||
| High | 435 (63.3) | 169 (48.1) | 246 (73.9) | 113 (59.2) | 189 (53.4) | 56 (35.0) | |||
Among tobacco users, 54.4% were male and 45.6% were female. Distributions of all characteristics differed by tobacco use for males. However, among females, race/ethnicity did not differ between never users and tobacco users (p=0.76). Among females, more tobacco users than never users were in high school, lived with at least one other tobacco user, and used a smartphone ≥20 hours per week. Among males the findings were parallel: More tobacco users than never users were in high school, lived with at least one other tobacco user, and used a smartphone for ≥20 hours per week. More male tobacco users reported high than low/uncertain selfesteem (59.2% vs 40.8%, respectively). For females, more tobacco users reported low/uncertain than high self-esteem (35.0% vs 65.0%).
A sensitivity analysis was conducted to compare descriptive characteristics by tobacco use after exclusion of youth who did not have smartphones. Results suggest that the distribution of tobacco users does not change after exclusion of youth who do not have smartphones.
Receiving or sharing tobacco-related information by reported channels
Distributions for each communication channel by overall and sex-stratified tobacco use are presented in Table 2. Agreement patterns differed by tobacco use via FF, YSCG, and DIG for receiving conventional tobacco-related information, FF, PUB, and DIG for receiving e-cigarette-related information, and FF for sharing both conventional tobaccorelated and e-cigarette-related information. Specifically, compared to never users, more tobacco users agreed that they receive conventional tobacco-related information via FF (59.0% vs 47.6%) and DIG (45.6% vs 36.0%) and e-cigaretterelated information via FF (51.0% vs 31.6%), PUB (39.6% vs 31.2%), and DIG (40.7% vs 28.4%). Additionally, tobacco users more frequently reported sharing conventional tobacco-related (41.0% vs 23.0%) and e-cigarette-related (37.0% vs 14.9%) information, compared to never users.
Table 2
Reported channels of receiving and sharing tobacco-related information by tobacco use overall and by sex (N=1038)
| Characteristics, n (%) | Tobacco usea | Tobacco use by sexa | |||||||
|---|---|---|---|---|---|---|---|---|---|
| Total | pb | Male | pb | Female | pb | ||||
| No | Yes | No | Yes | No | Yes | ||||
| 687 (66.2) | 351 (33.8) | 333 (63.6) | 191 (36.4) | 354 (68.9) | 160 (31.1) | ||||
| Receiving conventional tobacco-related information | |||||||||
| Friends and family (FF) | <0.001 | 0.041 | 0.002 | ||||||
| Agree | 327 (47.6) | 207 (59.0) | 147 (44.1) | 102 (53.4) | 180 (50.9) | 105 (65.6) | |||
| Disagree | 360 (52.4) | 144 (41.0) | 186 (55.9) | 89 (46.6) | 174 (49.1) | 55 (34.4) | |||
| Youth, school, or community groups (YSCG) | 0.049 | 0.026 | 0.76 | ||||||
| Agree | 330 (48.0) | 146 (41.6) | 150 (45.1) | 67 (35.1) | 180 (50.9) | 79 (49.4) | |||
| Disagree | 357 (52.0) | 205 (58.4) | 183 (54.9) | 124 (64.9) | 174 (49.1) | 81 (50.6) | |||
| Broadcast media (BRO) | 0.36 | 0.49 | 0.85 | ||||||
| Agree | 375 (54.6) | 181 (51.6) | 155 (46.6) | 83 (43.5) | 220 (62.2) | 98 (61.3) | |||
| Disagree | 312 (45.4) | 170 (48.4) | 178 (53.4) | 108 (56.5) | 134 (37.8) | 62 (38.7) | |||
| Print media (PRI) | 0.65 | 0.76 | 0.46 | ||||||
| Agree | 237 (34.5) | 126 (35.9) | 90 (27.0) | 54 (28.3) | 147 (41.5) | 72 (45.0) | |||
| Disagree | 450 (65.5) | 225 (64.1) | 243 (73.0) | 137 (71.7) | 207 (58.5) | 88 (55.0) | |||
| Public displays (PUB) | 0.50 | 0.39 | 0.63 | ||||||
| Agree | 300 (43.7) | 161 (45.9) | 120 (36.0) | 76 (39.8) | 180 (50.9) | 85 (53.1) | |||
| Disagree | 387 (56.3) | 190 (54.1) | 213 (64.0) | 115 (60.2) | 174 (49.1) | 75 (46.9) | |||
| Digital media (DIG) | 0.003 | 0.012 | 0.015 | ||||||
| Agree | 247 (36.0) | 160 (45.6) | 91 (27.3) | 71 (37.2) | 156 (44.1) | 89 (55.6) | |||
| Disagree | 440 (64.0) | 191 (54.4) | 242 (72.7) | 120 (62.8) | 198 (55.9) | 71 (44.4) | |||
| Receiving e-cigarette-related information | |||||||||
| Friends and family (FF) | <0.001 | <0.001 | <0.001 | ||||||
| Agree | 217 (31.6) | 179 (51.0) | 101 (30.3) | 87 (45.6) | 116 (32.8) | 92 (57.5) | |||
| Disagree | 470 (68.4) | 172 (49.0) | 232 (69.7) | 104 (54.4) | 238 (67.2) | 68 (42.5) | |||
| Youth, school, or community groups (YSCG) | 0.81 | 0.29 | 0.35 | ||||||
| Agree | 179 (26.1) | 89 (25.4) | 72 (21.6) | 34 (17.8) | 107 (30.2) | 55 (34.4) | |||
| Disagree | 508 (73.9) | 262 (74.6) | 261 (78.4) | 157 (82.2) | 247 (69.8) | 105 (65.6) | |||
| Broadcast media (BRO) | 0.98 | 0.72 | 0.97 | ||||||
| Agree | 304 (44.3) | 155 (44.2) | 122 (36.6) | 73 (38.2) | 182 (51.4) | 82 (51.3) | |||
| Disagree | 383 (55.7) | 196 (55.8) | 211 (63.4) | 118 (61.8) | 172 (48.6) | 78 (48.7) | |||
| Print media (PRI) | 0.20 | 0.48 | 0.14 | ||||||
| Agree | 191 (27.8) | 111 (31.6) | 73 (21.9) | 47 (24.6) | 118 (33.3) | 64 (40.0) | |||
| Disagree | 496 (72.2) | 240 (68.4) | 260 (78.1) | 144 (75.4) | 236 (66.7) | 96 (60.0) | |||
| Public displays (PUB) | 0.007 | 0.15 | 0.005 | ||||||
| Agree | 214 (31.2) | 139 (39.6) | 82 (24.6) | 58 (30.4) | 132 (37.3) | 81 (50.6) | |||
| Disagree | 473 (68.8) | 212 (60.4) | 251 (75.4) | 133 (69.6) | 222 (62.7) | 79 (49.4) | |||
| Digital Media (DIG) | <0.001 | 0.040 | <0.001 | ||||||
| Agree | 195 (28.4) | 143 (40.7) | 71 (21.3) | 56 (29.3) | 124 (35.0) | 87 (54.4) | |||
| Disagree | 492 (71.6) | 208 (59.3) | 262 (78.7) | 135 (70.7) | 230 (65.0) | 73 (45.6) | |||
| Sharing conventional tobacco-related information | |||||||||
| Friends and family (FF) | <0.001 | <0.001 | <0.001 | ||||||
| Agree | 158 (23.0) | 144 (41.0) | 82 (24.6) | 79 (41.4) | 76 (21.5) | 65 (40.6) | |||
| Disagree | 529 (77.0) | 207 (59.0) | 251 (75.4) | 112 (58.6) | 278 (78.5) | 95 (59.4) | |||
| Sharing e-cigarette-related information | |||||||||
| Friends and family (FF) | <0.001 | <0.001 | <0.001 | ||||||
| Agree | 102 (14.9) | 130 (37.0) | 57 (17.1) | 60 (31.4) | 45 (12.7) | 70 (43.8) | |||
| Disagree | 585 (85.1) | 221 (63.0) | 276 (82.9) | 131 (68.6) | 309 (87.3) | 90 (56.2) | |||
When stratified by sex, results indicate that female participants reported more often receiving tobacco-related information via each communication channel than did male participants; for example, nearly two-thirds (65.6%) of female tobacco users indicated that they receive conventional tobacco-related information from FF compared to just over half of male tobacco users (53.4%). This pattern was similar for DIG (female: 55.6%; male: 37.2%). Differences stratified by sex for receiving e-cigarette-related information were more pronounced in female tobacco users. Over half of female tobacco users received e-cigarette-related information from FF (57.5%), BRO (51.3%), PUB (50.6%), and DIG (54.4%); these percentages were not as high for male tobacco users for any channel. Frequencies for sharing conventional tobacco-related information were similar for female and male tobacco users (40.6% and 41.4%, respectively), but female tobacco users had higher frequencies of sharing e-cigarette-related information (43.8% and 31.4%, respectively).
Associations between each communication channel and tobacco use
Table 3 shows results from crude and adjusted logistic regression models that evaluated the odds of being a tobacco user based on receiving and sharing tobacco-related information. Appalachian youth who receive conventional tobacco-related information from FF (OR=1.58; 95% CI: 1.22–2.05) and DIG (OR=1.49; 95% CI: 1.15–1.94) had higher odds of being tobacco users than never users. However, adjustment for potential confounders resulted in some attenuation of these associations. Additionally, the OR for the YSCG-tobacco use association became statistically significant and represented an inverse relationship after accounting for potential confounders (OR=0.71; 95% CI: 0.53–0.94). Associations involving participants who receive e-cigaretterelated information were statistically significant for FF (OR=2.25; 95% CI: 1.73–2.94), PUB (OR=1.45; 95% CI: 1.11–1.90), and DIG (OR=1.74; 95% CI: 1.32–2.27). Relationships for FF and DIG decreased in magnitude after adjustment for potential confounders; the estimate for PUB inflated (OR=1.61; 95% CI: 1.20–2.16). Participants who share conventional tobacco-related information (OR=2.33; 95% CI: 1.77–3.07) and e-cigarette-related information (OR=3.37; 95% CI: 2.49–4.56) with FF had higher odds of being tobacco users compared to never users. These results also attenuated after adjustment; however, Appalachian youth continued to have nearly two-fold increased odds of being tobacco users if they indicated that they shared conventional tobacco-related information with FF (OR=2.07; 95% CI: 1.54– 2.79), and nearly three-fold increased odds if they shared e-cigarette-related information with FF (OR=2.99; 95% CI: 2.16–4.12). Inclusion of the interaction term between sharing e-cigarette-related information and sex in this model further attenuated the point estimate (OR=1.87; 95% CI: 1.20–2.92).
Table 3
Multivariable logistic regression models of associations between each communication channel and tobacco use (N=1038)
| Communication channels | Tobacco use | |||
|---|---|---|---|---|
| Crude | Adjusted | |||
| ORa, b | 95% CI | ORa, b | 95% CI | |
| Receiving conventional tobacco-related information | ||||
| Friends and family (FF) – Agree | 1.58 | (1.22–2.05) | 1.38 | (1.04–1.83) |
| Youth, school, or community groups (YSCG) – Agree | 0.77 | (0.59–1.00) | 0.71 | (0.53–0.94) |
| Broadcast media (BRO) – Agree | 0.89 | (0.69–1.15) | 0.95 | (0.72–1.27) |
| Print media (PRI) – Agree | 1.06 | (0.81–1.39) | 1.06 | (0.79–1.43) |
| Public displays (PUB) – Agree | 1.09 | (0.84–1.42) | 1.21 | (0.91–1.61) |
| Digital media (DIG) – Agree | 1.49 | (1.15–1.94) | 1.37 | (1.02–1.82) |
| Receiving e-cigarette-related information | ||||
| Friends and family (FF) – Agree | 2.25 | (1.73–2.94) | 1.99 | (1.50–2.64) |
| Youth, school, or community groups (YSCG) – Agree | 0.96 | (0.72–1.30) | 0.94 | (0.68–1.30) |
| Broadcast media (BRO) – Agree | 1.00 | (0.77–1.29) | 1.02 | (0.77–1.35) |
| Print media (PRI) – Agree | 1.20 | (0.91–1.59) | 1.16 | (0.85–1.57) |
| Public displays (PUB) – Agree | 1.45 | (1.11–1.90) | 1.61 | (1.20–2.16) |
| Digital media (DIG) – Agree | 1.74 | (1.32–2.27) | 1.60 | (1.19–2.15) |
| Sharing conventional tobacco-related information | ||||
| Friends and family (FF) – Agree | 2.33 | (1.77–3.07) | 2.07 | (1.54–2.79) |
| Sharing e-cigarette-related information | ||||
| Friends and family (FF) – Agree | 3.37 | (2.49–4.56) | 2.99 | (2.16–4.12) |
| Friends and family (FF) – Agreec | - | - | 1.87 | (1.20–2.92) |
The moderating effect of sex
Multivariable logistic regression models of associations between each communication channel and tobacco use stratified by sex are displayed in Table 4. Males who receive conventional tobacco-related information via YSCG had lower odds of being tobacco users compared to never users (OR=0.58; 95% CI: 0.39–0.88). Males (OR=1.75; 95% CI: 1.18–2.60) and females (OR=2.30; 95% CI: 1.53–3.47) had higher odds of being tobacco users if they indicated that they receive e-cigarette-related information through FF. Females who indicated that they receive e-cigaretterelated information via PUB (OR=1.85; 95% CI: 1.23–2.79) and DIG (OR=1.83; 95% CI: 1.22–2.75) had higher odds of being tobacco users compared to never users, but these associations were not statistically significant in males. Positive associations between sharing conventional tobacco-related information with FF and tobacco use, as well as sharing e-cigarette-related information with FF and tobacco use, were found for both males and females. However, these associations were stronger among females. For example, female youth who indicated that they share e-cigarette-related information with FF had nearly five times higher odds of being a tobacco user (OR=5.13; 95% CI: 3.18–8.28), whereas male youth had slightly less than twice the increased odds (OR=1.86; 95% CI: 1.19–2.92) of being a tobacco user, compared to female and male never users, respectively.
Table 4
Multivariable logistic regression models of associations between each communication channel and tobacco use by sex (N=1038)
| Communication channels | Tobacco use | |||
|---|---|---|---|---|
| Male | Female | |||
| ORa, b | 95% CI | ORa, b | 95% CI | |
| Receiving conventional tobacco-related information | ||||
| Friends and family (FF) – Agree | 1.27 | (0.86–1.86) | 1.50 | (0.99–2.27) |
| Youth, school, or community groups (YSCG) – Agree | 0.58 | (0.39–0.88) | 0.84 | (0.56–1.25) |
| Broadcast media (BRO) – Agree | 0.94 | (0.63–1.38) | 0.97 | (0.64–1.47) |
| Print media (PRI) – Agree | 1.00 | (0.65–1.53) | 1.16 | (0.77–1.75) |
| Public displays (PUB) – Agree | 1.21 | (0.81–1.80) | 1.21 | (0.81–1.82) |
| Digital media (DIG) – Agree | 1.40 | (0.92–2.13) | 1.34 | (0.89–2.01) |
| Receiving e-cigarette-related information | ||||
| Friends and family (FF) – Agree | 1.75 | (1.18–2.60) | 2.30 | (1.53–3.47) |
| Youth, school, or community groups (YSCG) – Agree | 0.90 | (0.55–1.47) | 0.99 | (0.64–1.53) |
| Broadcast media (BRO) – Agree | 1.06 | (0.71–1.58) | 0.97 | (0.65–1.46) |
| Print media (PRI) – Agree | 1.17 | (0.74–1.84) | 1.17 | (0.77–1.77) |
| Public displays (PUB) – Agree | 1.40 | (0.91–2.14) | 1.85 | (1.23–2.79) |
| Digital media (DIG) – Agree | 1.42 | (0.91–2.19) | 1.83 | (1.22–2.75) |
| Sharing conventional tobacco-related information | ||||
| Friends and family (FF) – Agree | 1.92 | (1.28–2.90) | 2.24 | (1.45–3.48) |
| Sharing e-cigarette-related information | ||||
| Friends and family (FF) – Agree | 1.86 | (1.19–2.92) | 5.13 | (3.18–8.28) |
DISCUSSION
This study indicates that there are sex differences in receiving and sharing tobacco information and tobacco consumption. However, there were some similarities in associations between communication channel use and tobacco use between males and females. Receiving e-cigarette-related information from FF resulted in elevated odds of tobacco use for both groups. Additionally, sharing tobacco-related information via FF was associated with tobacco use in males and females, though these associations were more pronounced in females. For males, receiving tobacco-related information from YSCG was associated with lower odds of tobacco use, perhaps suggesting that involvement in certain groups may protect male Appalachian youth from using tobacco. Overall, our findings indicate that several associations between e-cigarette-related communication and tobacco use are stronger among female Appalachian youth.
Our results are consistent with prior reports indicating male youth have higher frequencies of tobacco use than female youth19. However, the prevalence of e-cigarette use has been found to be similar among male and female middle and high school students18. Despite possible parallels in e-cigarette use prevalence, female Appalachian tobacco users had higher odds of receiving e-cigarette-related information via FF, PUB, and DIG, but these associations, other than FF, were not statistically significant in male tobacco users. These findings may appear different than previous work that indicated each additional exposure to e-cigarette marketing via internet, print, retail, and TV/movies resulted in lower odds of e-cigarette use among female youth compared to male youth14. However, our study focused on use of a subset of tobacco products (i.e. cigarettes, e-cigarettes, smokeless tobacco); thus, future research is needed to assess a broader array of products, especially newer products not available at the time of our data collection. Additionally, as noted previously, research suggests that male youth are more likely to use tobacco, especially combustible products, and use of products such as cigars, cigarillos and hookah may have shaped study findings19. Furthermore, an older study, examining the relationship between tobacco promotion and tobacco use susceptibility (i.e. cigarettes and chewing tobacco) in youth, found that female youth were less susceptible to tobacco use compared to male youth when exposed to tobacco promotional items such as purchase coupons or mail20. Nevertheless, studies investigating associations between any form of exposure to tobaccorelated information and use of conventional tobacco or e-cigarettes have reported decreased likelihood of use among female youth relative to male youth14,20. Perhaps factors unique to life for Appalachian youth, such as cultural norms surrounding tobacco acceptance and use, influence the extent to which they receive or share tobacco-related information and may explain differences across studies.
Various forms of tobacco communication have been linked to tobacco use in youth10,11,13-15, suggesting the need for antitobacco campaigns aimed at reducing tobacco initiation and continued use in youth. Prior work emphasizes a need to develop broad-based initiatives that reduce youth exposure to positive tobacco messages26,27. Our study results underscore the need for health campaigns that prioritize certain communication channels in order to prevent or reduce tobacco use among Appalachian youth. Further, it is important to recognize that audiences may differ by communication channel use. For example, the best ways to target interventions for youth who frequent digital media likely differ from the best ways to target youth who receive their information from friends and family. Of course, many youth likely receive or share tobacco-related information via multiple communication channels; thus, better understanding these channels and patterns of youth channel use is needed in order to combat the many information sources that encourage tobacco consumption. In Appalachia, youth attribute tobacco use to societal acceptance and values22. Our findings reinforce the need for culturally sensitive health campaigns that address the tobacco burden in Appalachia, potentially starting with more personalized sources of information and preventative measures. Even though many rural Appalachian residents support smoking cessation programs28, tailored anti-tobacco campaigns are needed to prevent tobacco experimentation and uptake by youth; thereby, reducing the demand for cessation programs later.
Acknowledging the breadth of sources, from the internet to community groups, that youth may be exposed to is necessary to enhance efforts in preventing tobacco use26,27. Digital media sources are more appealing and impactful to youth than traditional marketing15. Platforms like Twitter allow youth to engage with tobacco companies or others who are curious about or use tobacco products, and these interactions may lead to an additional public health burden15,29. Prioritizing anti-tobacco messages through channels such as digital media may limit tobacco market engagement; thus, curbing tobacco consumption among youth. In contrast to digital media, which may have a wide audience, more personalized communication contexts, such as interactions with FF and social groups, allow for the development of trust and thus may be influential. For example, in our study, receiving conventional tobacco-related and e-cigarette-related information from FF was related to more tobacco use by male and female Appalachian youth. Additional investigations by sociodemographic factors, such as race/ethnicity and socioeconomic status, may be useful in identifying the salience of specific communication channels, especially for vulnerable groups most at risk for tobacco use and its associated harms, and devising and delivering tobacco-prevention messaging for these groups.
Despite high Appalachian youth tobacco use rates, few studies have examined patterns of use and associated factors. One study, using data collected in the Central Appalachian region in 2015–2016, reported that over 10% of middle schoolers had used alternative tobacco products, such as hookah and cigarillos30. Another, using data from 2016 in the same region, found that e-cigarettes were the most commonly used product among high schoolers and that many e-cigarette users also consumed one or more additional tobacco products31. The dearth of studies in this high-use region illustrates the need for additional inquiry with these at-risk youth as well as increased preventative action, especially as new tobacco products, new communication modalities, and new approaches of marketing to youth gain traction.
Limitations
The study has some limitations. First, because participants self-reported information, there is the possibility of associated biases (e.g. recall). Second, not all tobacco products were examined; thus, the experiences of some tobacco users (e.g. hookah, cigar/cigarillo) are not reflected. Third, due to its cross-sectional nature, temporality between the primary exposures and outcome cannot be established. Fourth, our analysis included both ever and current tobacco users, and future work might benefit from separating these groups to gain insights into each use pattern, including differences in experimental and established use. Fifth, since data collection, the tobacco product landscape has experienced changes (e.g. new product options) and the array of communication modalities used by youth have expanded (e.g. TikTok); thus, future research is needed to examine potential shifts in Appalachian youth tobacco and communication channel use across time. Despite these limitations, our study provides evidence that tobacco use is associated with receiving and sharing tobacco-related information via certain communication channels and that these associations differ by sex.
CONCLUSIONS
Approximately one-third of Appalachian youth (33.8%) used one or more of the following tobacco products: cigarettes, smokeless tobacco, and e-cigarettes. More males than females used tobacco (54.4% vs 45.6%). Tobacco use was associated with increased odds of receiving e-cigaretterelated information from and sharing conventional tobaccorelated and e-cigarette-related information with friends and family. These associations were more profound among females, who also had higher odds of receiving e-cigaretterelated information via public displays and digital media. Our findings inform public health professionals that certain communication channels may be more salient to youth overall and influenced by important sociodemographic characteristics such as sex. Also, given these sex differences, health communication campaigns may need to devote additional attention to the ways in which youth use varying communication channels to ensure that messaging is likely to reach its intended audience(s).