
INTRODUCTION
Although evidence points towards increasing trends in access to outpatient mental health service use among adults in the United States1, a considerable proportion of individuals with serious psychological distress (SPD) still lack access to mental healthcare. SPD is an indicator of poor mental health that is severe enough to cause moderate-toserious impairment in social or occupational functioning and to require treatment2. Various studies have found that individuals with SPD continue to lag behind those with milder conditions (in terms of access to mental healthcare) and experience substantial unmet mental healthcare needs, despite being a high risk and extremely vulnerable group1,3,4.
Across the spectra of mental disorders, those with serious mental illness (SMI) such as schizophrenia, and other psychotic disorders warrant critical attention. Research shows people with SMI tend to lead unhealthy lifestyles typified by poor dietary habits, smoking, and physical inactivity with resultant worse physical outcomes and elevated mortality when compared to the general population4,5. To further compound this, studies indicate that people with SMI have diminished access to mental health due to limited financial resources, lack of health insurance and problems with adherence to complex treatment regimens6.
Emerging research has shown that DHT involving the use of smartphones, internet and other technologies for healthcare offers a cost-effective and feasible medium that may potentially improve access and continuity of mental health treatment services for people with mental disorders7. While prior studies have documented that individuals across all spectra of mental illness are reasonably digitally connected8,9, the sociodemographic determinants of digital engagement among those with SMI at the population level remain unexplored. Given the rapidly growing and evolving integration of technology in healthcare, a nuanced understanding of the utilization trends and factors associated with DHT use for obtaining healthcare among this group is crucial.
Accordingly, this study sought to address these research gaps by evaluating trends in DHT use as well as the sociodemographic determinants of DHT use among individuals with SPD.
METHODS
Data for this study were drawn from the National Health Interview Survey (NHIS), a nationally representative inperson survey conducted annually since 1957 by the National Center for Health Statistics. For this study, data were pooled from the 2013 to 2017 iterations of the NHIS. The survey utilizes a multistage area probability sample design, adjusting for non-response, and further allows for representativeness of the civilian, non-institutionalized population of the United States10. We assessed trends and sociodemographic factors associated with digital health technology use among adults (aged ≥18 years) with SPD in the US from 2013–2017. SPD was assessed using the Kessler-6 (K6) non-specific distress scale. The K6 obtains information on the frequency of six psychological distress symptoms during the past 30 days. Each item is coded 0–4 where 0 is ‘none of the time’ and 4 is ‘all the time’ (cumulative score ranging from 0 to 24). In this study, we used SPD as a proxy for SMI. This measure is highly validated and has demonstrated effectiveness as a screening tool for SMI2,11.
Consistent with prior studies12, SPD was defined as a score ≥13 on the K6. We excluded individuals with missing information on use of digital health technology (n=1; 0.02%). Our analysis of a publicly available deidentified dataset for a national survey did not meet the federal definition of human subjects research, according to the NIH Human Subjects Research Decision Tool from the Harvard Medical School IRB.
Use of DHT was based on the response of ‘yes’ to any of the following in the past 12 months: using the Internet to fill a prescription, scheduling a medical appointment, and communicating with a healthcare provider. Other data collected in the NHIS and used for this study, informed by previous studies of DHT use13, were used and included the following: age, race/ethnicity, educational level, gender, family income, birth place, health insurance status, geographical region of the United States, and number of comorbidities.
Statistical analysis
Survey-specific descriptive characteristics were used to estimate the prevalence of DHT use, overall and by sociodemographic and clinical characteristics. Differences in participant characteristics by DHT use were assessed using Rao-Scott χ2. Continuous variables were summarized using mean ± standard deviation, and categorical variables were summarized using proportions. We assessed the determinants of use of any DHT for health-related purposes using multivariable logistic regression and adjusted for all covariates. All analyses were performed using Stata version 16.0 (StataCorp LLC, College Station, Texas). For all analyses, a two-tailed alpha level of 0.05 was considered statistically significant. We accounted for the complex survey design of the NHIS to ensure that our results were generalizable to the US population. Variance estimation and person-level sample weights (representing the inverse probability of a person being selected) were obtained from the Integrated Public Use Microdata Series website14.
RESULTS
Our study population included 6110 adults with SPD from 2013–2017, representing 8.2 million adults annually; mean age of 46.7 ± 17.4 years; 60.9% were women, 65.4% were non-Hispanic Whites and 13.2% were aged ≥65 years. On average, 15.6% reported at least 1 technology-based interaction with the healthcare system; 7.6% (95% CI: 6.7–8.5) filled a prescription on the Internet, 8.2% (95% CI: 7.3– 9.3) scheduled a medical appointment on the Internet, and 9.4% (95% CI: 8.3–10.6) communicated with a healthcare provider by e-mail between 2013 and 2017.
Individuals with SPD who reported using any DHT to interact with the healthcare system were more likely to be younger (93.7% were aged <64 years), women (66.0%), non-Hispanic White (70.9%), born in the US (91.4%), have high income (29.2%), and have some college or higher education (72.1%) compared with those who did not report any use of DHT. However, they were less likely to report being non-insured (12.4%) (Table 1).
Table 1
General characteristics of adults with SPD, from the National Health Interview Survey, 2013–2017
[i] GED: General Equivalency Diploma. HS: high school. SD: standard deviation. P values were calculated using Rao‐Scott χ2. Family income (based on the percentage of family income relative to the federal poverty limit from the US Census Bureau, categorized as high income [≥400%], middle income [200 to <400%], low income [125 to <200%], and lowest income [<125%]). Comorbidities included were COPD, asthma, cancer, arthritis, ulcer, liver disease and kidney disease.
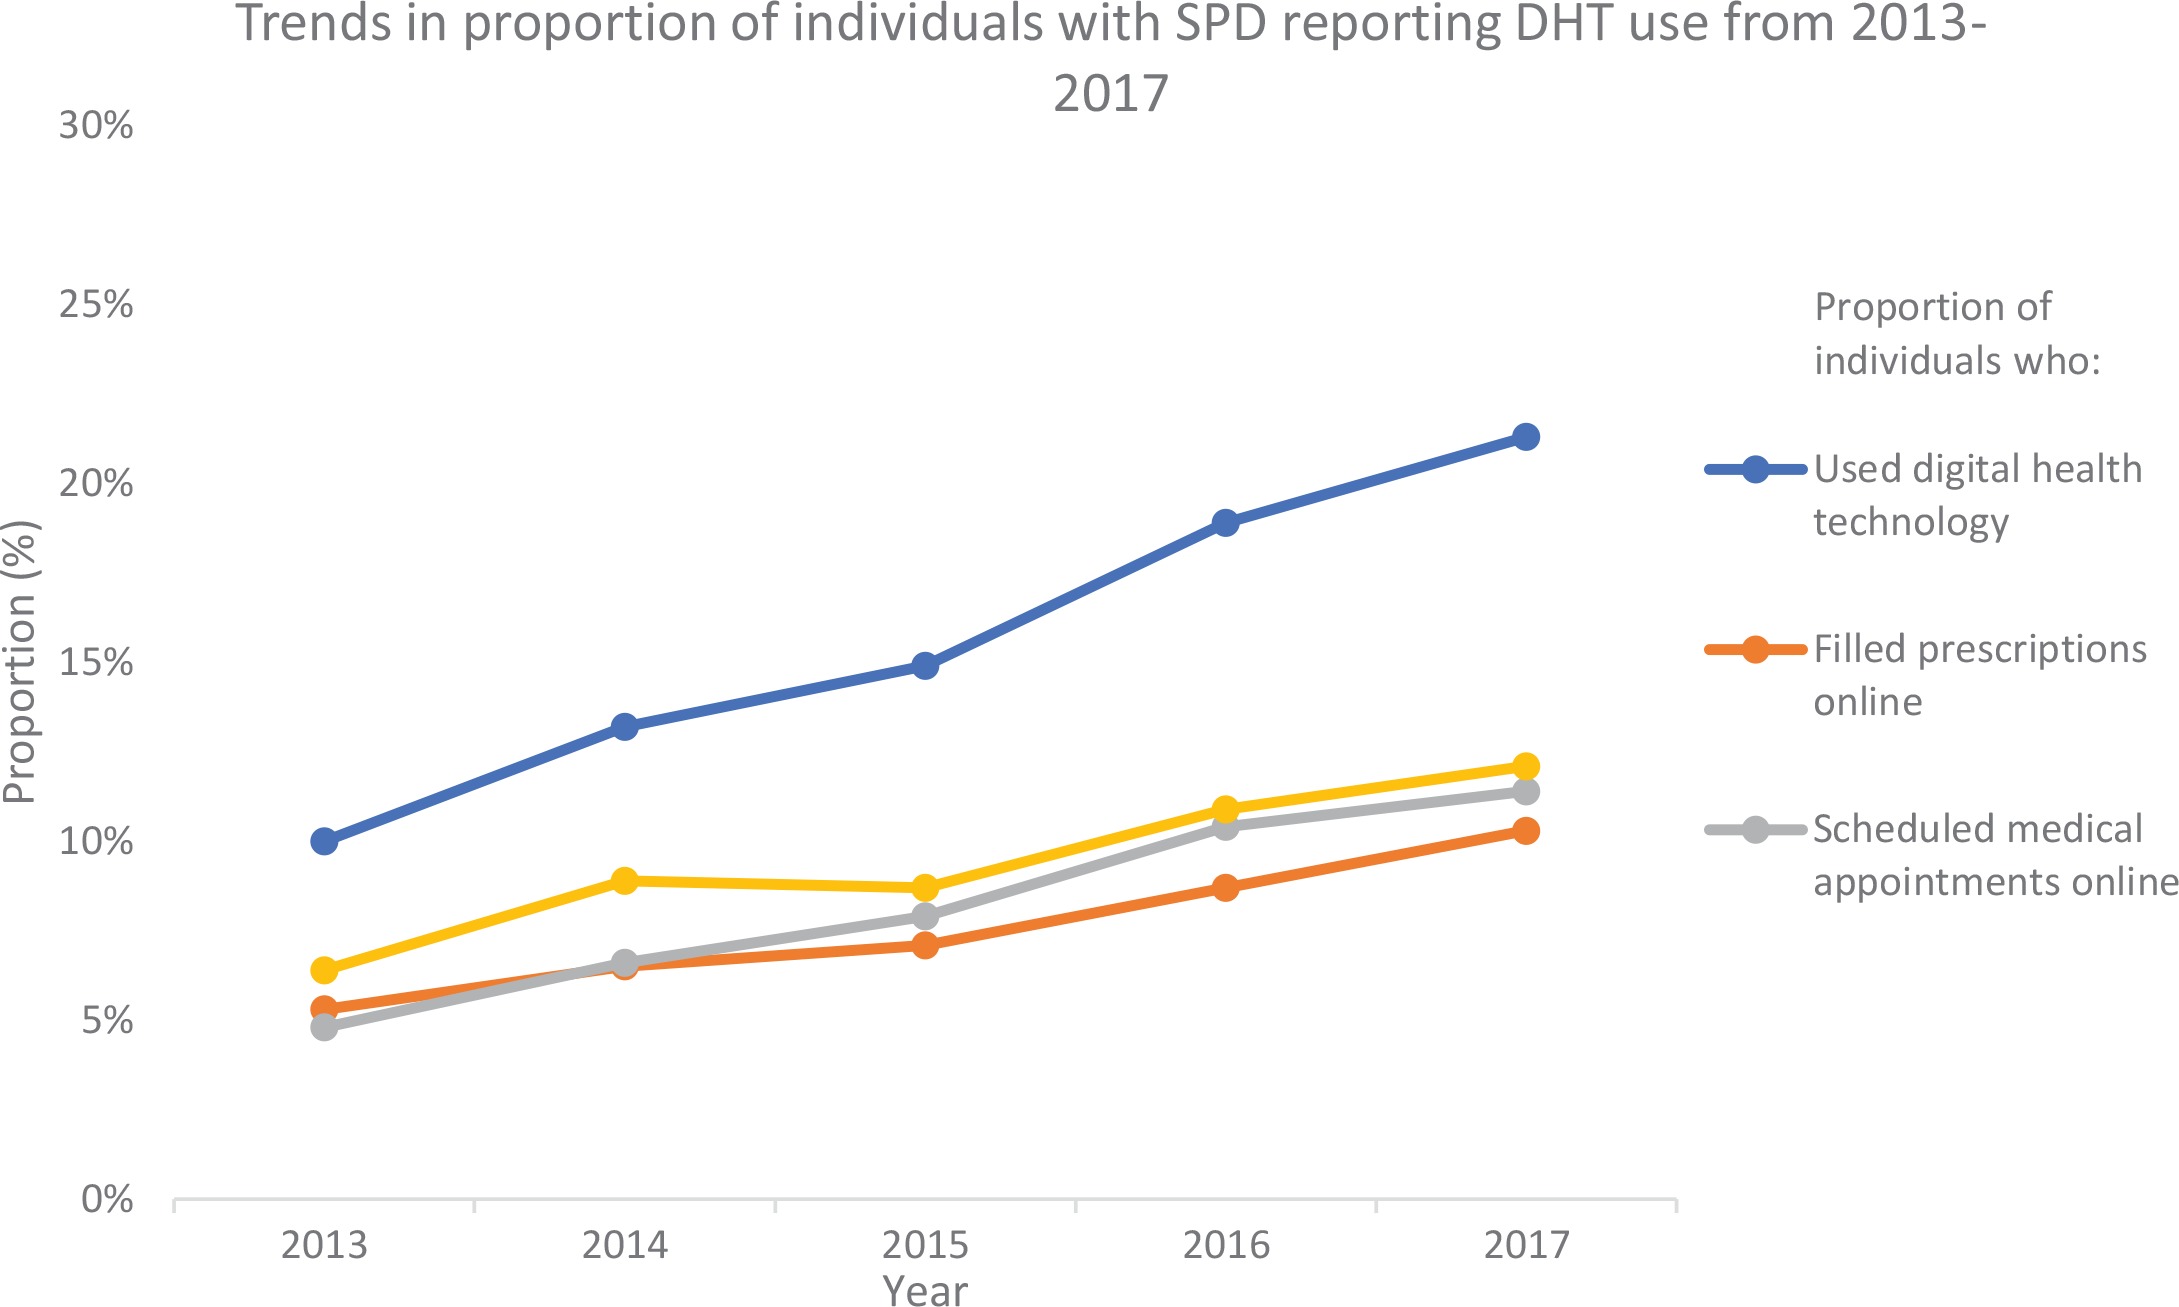
The proportion of individuals with SPD who utilized at least DHT to interact with the healthcare system increased significantly from 10.0% in 2013 to 21.3% in 2017 (p<0.001) (Figure 1). Within the same period, the proportion who filled a prescription on the Internet increased from 5.3% to 10.3% (p=0.006), those who scheduled a medical appointment on the Internet increased from 4.8% to 11.4% (p<0.001), and those who communicated with a healthcare provider by e-mail increased non-significantly from 6.4% to 12.1% (p=0.07) (Figure 1).
In multivariable analysis, younger age, female sex, higher education level, high income, having public health insurance, belonging to the western United States regions, and having at least one chronic health condition were significant predictors of using DHT (Table 2).
Table 2
Determinants of use of digital health technology to interact with the healthcare system among adults with serious psychological distress, from the National Health Interview Survey, 2013–2017
| Variables | Use of digital health technology | |||
|---|---|---|---|---|
| ORa (95% CI) | p | AORb (95% CI) | p | |
| Age (years) | ||||
| ≥65 (Ref.) | 1 | 1 | ||
| 40–64 | 2.21 (1.62–3.03) | <0.001 | 2.36 (1.66–3.35) | <0.001 |
| 18–39 | 2.97 (2.13–4.15) | <0.001 | 3.35 (2.23–5.03) | <0.001 |
| Sex | ||||
| Male (Ref.) | 1 | 1 | ||
| Female | 1.29 (1.05–1.58) | 0.014 | 1.28 (1.02–1.60) | 0.034 |
| Race/ethnicity | ||||
| Non-Hispanic White (Ref.) | 1 | 1 | ||
| Non-Hispanic Black | 0.85 (0.64–1.13) | 0.27 | 1.08 (0.79–1.49) | 0.62 |
| Hispanic | 0.52 (0.38–0.71) | <0.001 | 0.71 (0.47–1.07) | 0.10 |
| Non-Hispanic Other | 1.29 (0.81–2.03) | 0.28 | 1.29 (0.76–2.20) | 0.94 |
| Birth place | ||||
| Outside US (Ref.) | 1 | 1 | ||
| US | 1.79 (1.27–2.51) | 0.001 | 1.27 (0.84–1.93) | 0.26 |
| Education level | ||||
| HS/GED or less than HS (Ref.) | 1 | 1 | ||
| Some college or higher | 4.01 (3.26–4.94) | <0.001 | 2.92 (2.33–3.64) | <0.001 |
| Family income | ||||
| Lowest (Ref.) | 1 | 1 | ||
| Low | 1.21 (0.91–1.62) | 0.19 | 1.16 (0.84–1.58) | 0.35 |
| Middle | 2.24 (1.71–2.95) | <0.001 | 1.84 (1.33–2.53) | <0.001 |
| High | 4.01 (2.98–5.38) | <0.001 | 2.79 (1.96–3.97) | <0.001 |
| Insurance status | ||||
| Uninsured (Ref.) | 1 | 1 | ||
| Public | 2.84 (2.04–3.96) | <0.001 | 1.58 (1.08–2.29) | 0.017 |
| Private | 1.21 (0.88–1.67) | 0.25 | 1.39 (0.96–2.02) | 0.08 |
| Region | ||||
| Northeast (Ref.) | 1 | 1 | ||
| Midwest | 1.13 (0.80–1.62) | 0.48 | 1.14 (0.77–1.69) | 0.51 |
| South | 0.88 (0.63–1.22) | 0.63 | 1.04 (0.72–1.51) | 0.82 |
| West | 1.45 (1.02–2.04) | 1.02 | 1.51 (1.03–2.21) | 0.033 |
| Comorbidities | ||||
| 0 (Ref.) | 1 | 1 | ||
| 1 | 1.25 (0.99–1.58) | 0.06 | 1.39 (1.06–1.84) | 0.018 |
| ≥2 | 1.06 (0.85–1.32) | 0.62 | 1.62 (1.23–2.14) | 0.001 |
DISCUSSION
In this nationally representative study, we evaluated the trends and sociodemographic determinants of using digital technology to interact with the healthcare system among those with mental disorders. We found that the use of DHT among individuals with SPD doubled from 10.0% in 2013 to 21.3% in 2017, indicating that this population is becoming increasingly digitally connected. Despite the encouraging evidence showing increasing trends in digital health interactions from our study, findings reveal that some adults with SPD may be digitally disconnected.
Findings indicate that among people with SPD, older age, male sex, lower education level, and lower income, were associated with lower odds of using DHT to interact with the healthcare system. These findings are consistent with previous research which suggests that trends in DHT use across the general population is increasing but disparities in DHT engagement still exist, which could potentially exacerbate health disparities13,15. The finding that individuals with higher education level and high-income high SES background are more likely to use DHT matches observations from past studies16. That notwithstanding, cost, lack of access to Internet, and lack of awareness have been cited as some of the reasons accounting for disparities in the use of DHT among individuals with low SES17,18.
Given the rapid transition to technology-supported healthcare services to combat the ongoing SARS COVID-19 pandemic19, identifying patient groups among those with mental illness that lack digital access is crucial from a public health perspective. These results, indicating disproportionately lower rates of digital health interactions among vulnerable sociodemographic groups of people with SPD, will guide health systems, stakeholders and policy players to develop targeted public health strategies to address these critical gaps. Additionally, since low socioeconomic status is correlated with poor mental health outcomes, we theorize that DHT use may be a measure for SES and could help identify high risk and vulnerable groups among those with SPD.
Strengths and limitations
One major strength of this study is the use of the NHIS which is a nationally representative survey and enables generalizability of our findings to the non-institutionalized US population. However, the findings of our study should be interpreted with the following limitations in mind. First, data on DHT use were self-reported and subject to recall bias. Second, the cross-sectional nature of the study precludes any causal inferences. Lastly, while we found increased trends in DHT use over the 5-year period, the NHIS data did not provide any information on digital device ownership, access to the Internet, and frequency of DHT use – all of which may explain the growing trend in DHT engagement and inform future interventions.
CONCLUSIONS
This study observed an increasing trend in the utilization of DHT among adults with SPD in the US between 2013 and 2017. However, a subset of people with SPD may not be digitally connected. Therefore, future studies that focus on investment in technology as well as strategies to reduce digital access disparities in adults with SPD are essential.