
INTRODUCTION
Different types of stigmas – interpersonal, institutional, and internalized – have extensive effects on the health outcomes and health-seeking behaviors of people living with HIV (PLHIV)1. PLHIV from disadvantaged groups can experience stigma in multiple, often intersecting ways1. While South Africa has outlawed HIV-based discrimination2, the reality is that bigotry and prejudice may persist even with anti-discrimination laws because it is impossible to legislate how people feel and think. True change can only come from the volition of the people who affect and are affected by stigma. Studies have suggested that one way people’s volition can be changed in relation to HIV stigma is through the educational message, U=U, or Undetectable Equals Untransmittable3,4. Built on strong scientific evidence showing that individuals with undetectable viral loads cannot transmit HIV5,6, the potential effectiveness of the U=U message lies in the fact that it addresses the underlying fear that feeds HIV stigma, namely, that PLHIV might transmit the disease7,8. Among PLHIV, awareness of the U=U message has already been demonstrated to be empowering and to be associated with increased comfort with sharing their HIV status9. The potential impact of the U=U message among the non-HIV population is equally important but less known.
Against a backdrop of low HIV disclosure levels10–12, worrisome levels of resistance to antiretroviral therapy (ART)13–15, and the largest HIV epidemic in the world16, there is an urgent need for the rapid uptake of the U=U message in South Africa. While seven African countries met the 90– 90–90 targets17, South Africa was not one of them. These 90–90–90 targets aimed to increase the percentage of people living with HIV who were diagnosed, the percentage of those on treatment among those diagnosed, and the percentage virally suppressed among those on treatment to ≥90% by 202017. South Africa’s status in 2020 was 84% diagnosed, 87% of those diagnosed on treatment, and 90% of those treated virally suppressed (which equates to 66% of all PLHIV being virologically suppressed)18. Addressing stigma is critical to meeting these, and other newer targets, including the proposed fourth 90 target of improving quality of life among PLHIV19. From a health equity lens, the U=U message may also help in reducing onward transmission, increasing testing, improving linkage to care, and incentivizing treatment adherence among disadvantaged groups such as people of low socio-economic status, undocumented immigrants, commercial sex workers, those living with a disability, and other vulnerable groups.
The U=U movement is still in its infancy in South Africa. In 2020, The South Africa HIV Survivors and Partners Network, as part of a concerted effort to advance the U=U campaign locally, mobilized >100 women living with HIV as U=U ambassadors and convened several HIV-related civil society organizations4. A key challenge noted so far has been low awareness of the U=U message among advocates and partner organizations4. Evidence from South Africa on awareness and the impact of the U=U message in the broader population will be critical to help inform clinical and public health practice, programs, and policy. Consequently, this study had two objectives: 1) to assess unmet treatment needs among PLHIV and compare self-rated health and perceived stigma between PLHIV and the non-HIV population; and 2) to estimate the percentage of PLHIV and the non-HIV population reporting belief in the U=U message, and the relationship between belief and perceived stigma within the separate strata (i.e. HIV and non-HIV populations).
METHODS
Data sources
Data came from two sources. 1) The South African National HIV Prevalence, HIV Incidence, Behavior and Communication Survey, wave 5 (SABSSM-V); and 2) The Positive Perspectives Survey of PLHIV, wave 2 (PP2). SABSSM-V was used to analyze HIV seroprevalence, U=U belief prevalence and impact of the U=U message, while PP2 was used to examine unmet needs related to ART as well as PLHIV-reported receipt of U=U counseling from their HCPs.
SABSSM-V
We analyzed the SABSSM-V conducted between December 2016 and January 201820. This household survey was designed to yield nationally representative estimates of the non-institutionalized South African population using a multi-stage, cluster sampling design (household response rate=82.2%). Of 39132 eligible individuals, 93.6% agreed to be interviewed and 61.1% provided a blood specimen for HIV-testing, in addition to the completed questionnaires. Our analytical sample comprised persons aged ≥18 years (n=26875). Data on laboratory-confirmed HIV status was present for 17256 adults aged ≥18 years.
PP2
We analyzed data for 179 PLHIV on ART aged ≥18 years from South Africa who participated in PP29,21-23. In total, 44 were recruited from ongoing panels of PLHIV; 114 from non-governmental organizations (NGOs), patient associations, patient advocacy groups, patient support groups, or HIV charities, and 21 via social media (Facebook). The survey was web-based and administered in English, Afrikaans, Zulu, and Sotho. Ethical review was provided by the Sefako Makgatho Research Ethics Committee (no. SMUREC/M/223/2019).
Measures
SABSSM-V
HIV status
Blood spots were collected on filter paper from a finger prick and transported to a laboratory for testing24. Three enzyme immunoassays (Roche Elecys HIV Ag/Ab assay, Roche Diagnostics, Mannheim, Germany, and Genscreen Ultra HIV Ag/Ab assay, Bio-Rad Laboratories, California, US) were used to test for HIV infection. When two enzyme immunoassays agreed, this confirmed a result; where there was a disagreement, the third test broke the tie. Since HIV testing was anonymous, survey respondents could not be provided with their results. This blinding of the laboratory results provided a unique opportunity to compare laboratory-confirmed vs self-reported HIV status. Given that HIV stigma is intricately tied with first being aware of ones HIV-positive status, we were interested in exploring whether perceived stigma and other subjective measures of overall health and wellbeing differed among PLHIV aware of their HIV status (i.e. status-aware PLHIV); PLHIV not aware of their HIV-status (i.e. status-unaware PLHIV), and people not living with HIV. Our definition of ‘awareness’ of HIV status was based strictly on self-report as a cognitive marker, and not on any biomarker (e.g. ART analytes in the bloodstream)24, since we were interested in just the psychosocial aspects of being conscious of ones HIV status. Self-reported HIV status was defined based on either of the following: 1) respondents indicated they were previously tested for HIV and reported the result of their last test as ‘Positive’; and 2) respondents answered ‘Yes’ when asked ‘Do you currently have any of the following illnesses? – HIV’.
U=U beliefs and HIV stigma
Belief in U=U-related constructs was assessed, including the belief that the risk of HIV transmission through sex can be reduced by an HIV-positive partner consistently taking drugs that treat HIV; that ART could prevent vertical HIV transmission; that a woman living with HIV could give birth to an HIV-negative baby; but that conversely, untreated pregnant women living with HIV could transmit HIV to their unborn children.
We were interested in contrasting the impact of the U=U message on perceived stigma against the impact of ignorant narratives of how HIV is transmitted. Participants were asked: ‘Can a person get HIV by sharing food with someone who is living with HIV?’. As outcomes, several indicators of stigma were assessed: ‘If you knew that a shopkeeper or food seller had HIV, would you buy food from them?’; ‘Would you buy fresh vegetables from a shopkeeper or vendor if you knew that this person had HIV?’; ‘Would you want to keep the HIV-positive status of a family member a secret?’; ‘Are you comfortable talking to at least one member of your family about HIV/AIDS?’; ‘Would you be willing to care for a family member with AIDS?’; ‘If a teacher has HIV but is not sick, should he or she be allowed to continue teaching?’; ‘If a pupil has HIV but not sick, should he or she be allowed to continue to go to school?’; ‘Do you think children living with HIV should be able to attend school with children who are HIV-negative?’; ‘Is it a waste of money to train or give a promotion to someone with HIV/AIDS?’; and would you say ‘A person would be foolish to marry a person who is living with HIV/AIDS’.
Self-rated health
Respondents were classified as having optimal overall health if they answered ‘excellent’ or ‘good’ to the question: ‘In general, would you say that your health is excellent, good, fair, or poor?’. Respondents were also asked about their mental and emotional well-being during the past 30 days, including whether they felt ‘tired out’, ‘nervous’, ‘hopeless’, ‘depressed’, ‘sad’, or ‘worthless’.
PP2
Medication-related concerns
Respondents’ concerns regarding short-, medium-, and long-term impacts of their HIV treatment were measured, including worries about long-term side effects, potential interactions with other medications, impact on body and/or body shape, impact on overall health and well-being, and unknown long-term impact.
Communication with healthcare providers (HCPs)
The survey assessed perceived comfort discussing with HCPs concerns about various salient treatment-related issues, including preventing transmission, their emotional well-being, as well as their privacy and not disclosing their HIV status. Participants were also asked whether their HCP had told them of ‘U=U’.
Analysis
Data from SABSSM-V were weighted to yield nationally representative results for all South African adults aged ≥18 years. Prevalence estimates were calculated overall and by various demographic characteristics. Among those reporting they were not living with HIV (regardless of their laboratory test), we assessed every and past-year HIV screening, overall and by various clinical, demographic, and risk profiles.
Based on agreement between laboratory-confirmed and self-reported HIV status, participants aged ≥18 years were classified into 3 groups of: negative laboratory test and self-reported non-HIV status (i.e. not living with HIV, n=23371); positive laboratory test and self-reported non-HIV status (i.e. status-unaware PLHIV, n=1912); and positive laboratory test and a self-report of living with HIV (i.e. status-aware PLHIV, n=1496). We excluded n=96 adults with a negative laboratory test and a self-report of living with HIV as potential misclassification cases. Adjusted prevalence ratios (APR) were calculated in a multivariable Poisson regression model to compare stigma perceptions between the groups, using status-aware PLHIV as the reference category. Adjusted prevalence ratios were also computed to measure the relationship between U=U-related beliefs and perceived stigma, separately for PLHIV and the non-HIV population (self-reported statuses). All adjusted analyses controlled for age, gender, urbanicity, and race/ethnicity.
Data from the PP2 survey were analyzed using percentages and means. Subgroup differences were assessed qualitatively because of the limited sample size. All statistical analyses were performed using Stata V14.
RESULTS
Characteristics of the South African adult population (SABSSM-V)
Of South African adults aged ≥18 years, 69.4% were from urban areas, 60.1% were aged 18–39 years, 86.4% were heterosexual, 78.6% were Black Africans, and 52.6% were women. Overall, 95.7% were native-born, 3.2% were documented migrants, and 1.1% were undocumented migrants/asylum seekers/refugees/other (Table 1).
Table 1
Percentage living with HIV among all South African adults and those accessing HIV screening among those who reported not living with HIV, South African National HIV, Behavior, And Health Survey, 2017–2018
| Characteristics | % (n) | % With positive HIV test | % Reporting they had ever had an HIV test among those reporting they were not living with HIV | % Reporting they had a past-year HIV test among those reporting they were not living with HIV |
|---|---|---|---|---|
| Total | 100 (26875) | 20.0 (18.9–21.1) | 77.1 (76.1–78.1) | 52.6 (51.5–53.8) |
| Province | ||||
| Western Cape | 12.8 (2112) | 12.0 (9.8–14.1) | 76.9 (74.5–79.3) | 41.2 (38.5–43.9) |
| Eastern Cape | 10.8 (1986) | 21.9 (18.0–25.7) | 69.5 (66.5–72.5) | 45.9 (42.6–49.1) |
| Northern Cape | 2.1 (1435) | 13.0 (9.7–16.3) | 74.7 (71.6–77.8) | 48.8 (45.2–52.3) |
| Free State | 4.8 (1157) | 23.2 (19.5–27.0) | 83.6 (80.7–86.4) | 54.2 (50.2–58.2) |
| KwaZulu-Natal | 18.2 (8750) | 27.1 (24.1–30.0) | 71.5 (69.4–73.7) | 49.5 (47.1–51.8) |
| North-West | 6.9 (1712) | 23.1 (19.3–26.9) | 82.4 (80.0–84.9) | 63.3 (60.1–66.5) |
| Gauteng | 27.4 (4405) | 17.5 (15.0–20.1) | 81.3 (79.0–83.5) | 55.1 (52.2–58.0) |
| Mpumalanga | 7.8 (3214) | 24.3 (21.1–27.5) | 80.9 (78.4–83.4) | 63.2 (60.2–66.3) |
| Limpopo | 9.4 (1630) | 16.3 (13.2–19.3) | 73.8 (70.7–76.8) | 57.4 (53.9–60.8) |
| Geographical location | ||||
| Urban | 69.4 (15050) | 18.3 (17.0–19.7) | 79.2 (78.0–80.4) | 52.8 (51.3–54.3) |
| Rural informal (tribal areas) | 25.3 (8433) | 24.3 (21.9–26.7) | 72.3 (70.5–74.1) | 54.3 (52.3–56.3) |
| Rural (farms) | 5.4 (2918) | 21.8 (17.5–26.1) | 71.5 (68.4–74.7) | 42.7 (39.4–46.1) |
| Age (years) | ||||
| 18–29 | 32.9 (9027) | 13.9 (12.2–15.6) | 75.5 (73.9–77.1) | 56.5 (54.5–58.4) |
| 30–39 | 27.2 (6044) | 28.4 (25.7–31.0) | 83.5 (81.6–85.5) | 58.2 (55.6–60.7) |
| 40–49 | 15.8 (4173) | 30.1 (26.9–33.3) | 82.9 (80.6–85.2) | 55.2 (52.2–58.2) |
| 50–59 | 12.4 (3680) | 18.3 (15.5–21.1) | 79.7 (77.3–82.1) | 47.4 (44.4–50.4) |
| ≥60 | 11.7 (3951) | 6.2 (4.8–7.6) | 58.7 (56.0–61.5) | 32.4 (29.8–35.1) |
| Sexual orientation | ||||
| Heterosexual | 86.4 (21540) | 20.6 (19.4–21.8) | 77.4 (76.4–78.4) | 52.7 (51.5–53.9) |
| Bisexual | 1.6 (282) | 15.6 (7.6–23.7) | 76.8 (68.1–85.4) | 51.9 (42.3–61.4) |
| Gay | 6.4 (2424) | 15.2 (11.2–19.3) | 73.6 (68.3–78.8) | 56.1 (50.0–62.2) |
| Lesbian | 5.6 (2595) | 20.6 (15.8–25.3) | 74.4 (69.6–79.1) | 46.5 (40.8–52.3) |
| Race | ||||
| Black African | 78.6 (19939) | 24.4 (23.0–25.8) | 78.3 (77.2–79.4) | 56.7 (55.3–58.0) |
| White | 9.6 (1489) | 1.6 (0.1–3.0) | 72.7 (69.4–76.0) | 33.2 (29.6–36.8) |
| Colored | 8.9 (3114) | 7.7 (5.7–9.8) | 77.0 (74.9–79.1) | 47.0 (44.5–49.6) |
| Indian/Asian | 2.9 (1814) | 0.5 (0.1–1.0) | 63.0 (57.1–68.9) | 33.5 (28.1–38.8) |
| Education level | ||||
| No school | 7.7 (2469) | 23.4 (19.5–27.3) | 62.2 (58.5–65.9) | 41.1 (37.4–44.9) |
| ≤ 6th grade | 11.1 (2766) | 27.1 (22.9–31.4) | 68.6 (65.6–71.6) | 45.1 (41.8–48.4) |
| 7th to 12th grade | 66.6 (13293) | 23.4 (21.9–25.0) | 79.1 (77.8–80.3) | 54.0 (52.4–55.6) |
| Further studies incomplete | 3.5 (555) | 10.0 (4.3–15.8) | 86.5 (81.8–91.1) | 61.9 (54.8–69.1) |
| Further studies completeda | 10.9 (1812) | 8.6 (5.5–11.7) | 85.3 (82.8–87.9) | 51.4 (47.7–55.2) |
| Don’t know | 0.2 (39) | 11.0 (-1.6–23.5) | 67.4 (44.2–90.6) | 39.0 (15.1–63.0) |
| Past-month income source | ||||
| Salary/earnings | 36.5 (7526) | 18.8 (16.8–20.8) | 83.1 (81.6–84.6) | 55.1 (53.1–57.1) |
| Contributions by family members or relatives | 3.4 (727) | 22.7 (16.5–29.0) | 77.8 (72.6–83.1) | 53.5 (47.3–59.8) |
| Government pensions/grants | 10.0 (3201) | 18.9 (15.9–22.0) | 67.4 (64.4–70.4) | 43.8 (40.6–47.0) |
| Grants/donations by private welfare organizations | 4.8 (1262) | 23.8 (19.0–28.7) | 69.1 (64.8–73.5) | 45.0 (40.3–49.6) |
| Other | 4.4 (845) | 24.1 (18.1–30.1) | 77.0 (71.9–82.2) | 48.7 (42.8–54.7) |
| No monthly income | 41.0 (10157) | 21.4 (19.6–23.2) | 74.8 (73.3–76.4) | 53.7 (51.9–55.5) |
| Nationality | ||||
| South African | 95.7 (22903) | 20.4 (19.2–21.6) | 77.1 (76.2–78.1) | 52.8 (51.7–54.0) |
| Documented migrant | 3.2 (490) | 20.4 (12.9–27.8) | 81.4 (76.1–86.8) | 49.7 (42.1–57.3) |
| Undocumented migrant/asylum seeker/refugee/other | 1.1 (199) | 29.4 (16.5–42.2) | 61.4 (48.1–74.6) | 45.5 (33.1–57.9) |
| Sex | ||||
| Man | 47.4 (11085) | 15.2 (13.6–16.8) | 73.1 (71.5–74.7) | 48.9 (47.1–50.7) |
| Woman | 52.6 (15756) | 24.4 (22.8–26.0) | 80.8 (79.7–82.0) | 56.1 (54.7–57.6) |
| Marital status | ||||
| Married | 31.2 (6908) | 14.4 (12.6–16.1) | 80.8 (79.3–82.4) | 50.5 (48.5–52.6) |
| Never married | 59.7 (14402) | 23.6 (22.0–25.2) | 76.3 (75.0–77.6) | 55.5 (54.0–57.0) |
| Divorced/separated/widowed | 9.1 (2453) | 20.6 (17.2–24.1) | 69.3 (66.1–72.5) | 41.7 (38.3–45.1) |
| Living arrangements | ||||
| Married, living with husband/wife | 28.6 (6301) | 14.0 (12.2–15.8) | 80.8 (79.2–82.4) | 50.7 (48.5–52.8) |
| Married, living apart | 14.5 (3406) | 24.2 (21.0–27.4) | 78.2 (75.6–80.9) | 53.5 (50.2–56.7) |
| Living together with boyfriend/girlfriend/civil union | 8.2 (1719) | 24.3 (20.2–28.5) | 84.8 (81.6–88.1) | 61.5 (57.2–65.7) |
| In a steady relationship but not living together | 19.2 (4744) | 25.5 (22.8–28.3) | 79.0 (76.9–81.2) | 57.7 (55.0–60.3) |
| Single, not in a steady relationship | 29.5 (7483) | 20.3 (18.0–22.5) | 69.4 (67.5–71.3) | 48.4 (46.3–50.5) |
| Disability | ||||
| Yes | 3.2 (904) | 23.2 (13.7–32.7) | 67.7 (61.9–73.6) | 37.7 (31.8–43.6) |
| No | 96.7 (22803) | 20.4 (19.3–21.6) | 77.4 (76.4–78.4) | 53.1 (51.9–54.3) |
| Don’t know | 0.1 (24) | 13.1 (-10.9–37.2) | 70.5 (42.1–99.0) | 57.2 (25.6–88.9) |
| Non-HIV comorbidityb | ||||
| Yes | 21.8 (5872) | 24.8 (22.4–27.2) | 78.2 (76.4–80.1) | 50.7 (48.4–53.0) |
| No | 78.2 (21003) | 18.8 (17.5–20.1) | 76.8 (75.7–77.9) | 53.2 (51.8–54.5) |
HIV prevalence and screening (SABSSM-V)
Of South African adults aged ≥18 years during 2017–2018, 20.0% were HIV seropositive. Seroprevalence was highest in KwaZulu-Natal (27.1%), those living in tribal areas (24.3%), aged 40–49 years (30.1%), Black Africans (24.4%), undocumented migrants/asylum seekers/refugees/other (29.4%), women (24.4%), those never married (23.6%), those with ≤ 6th grade education (27.1%), and those with comorbidity (24.8%).
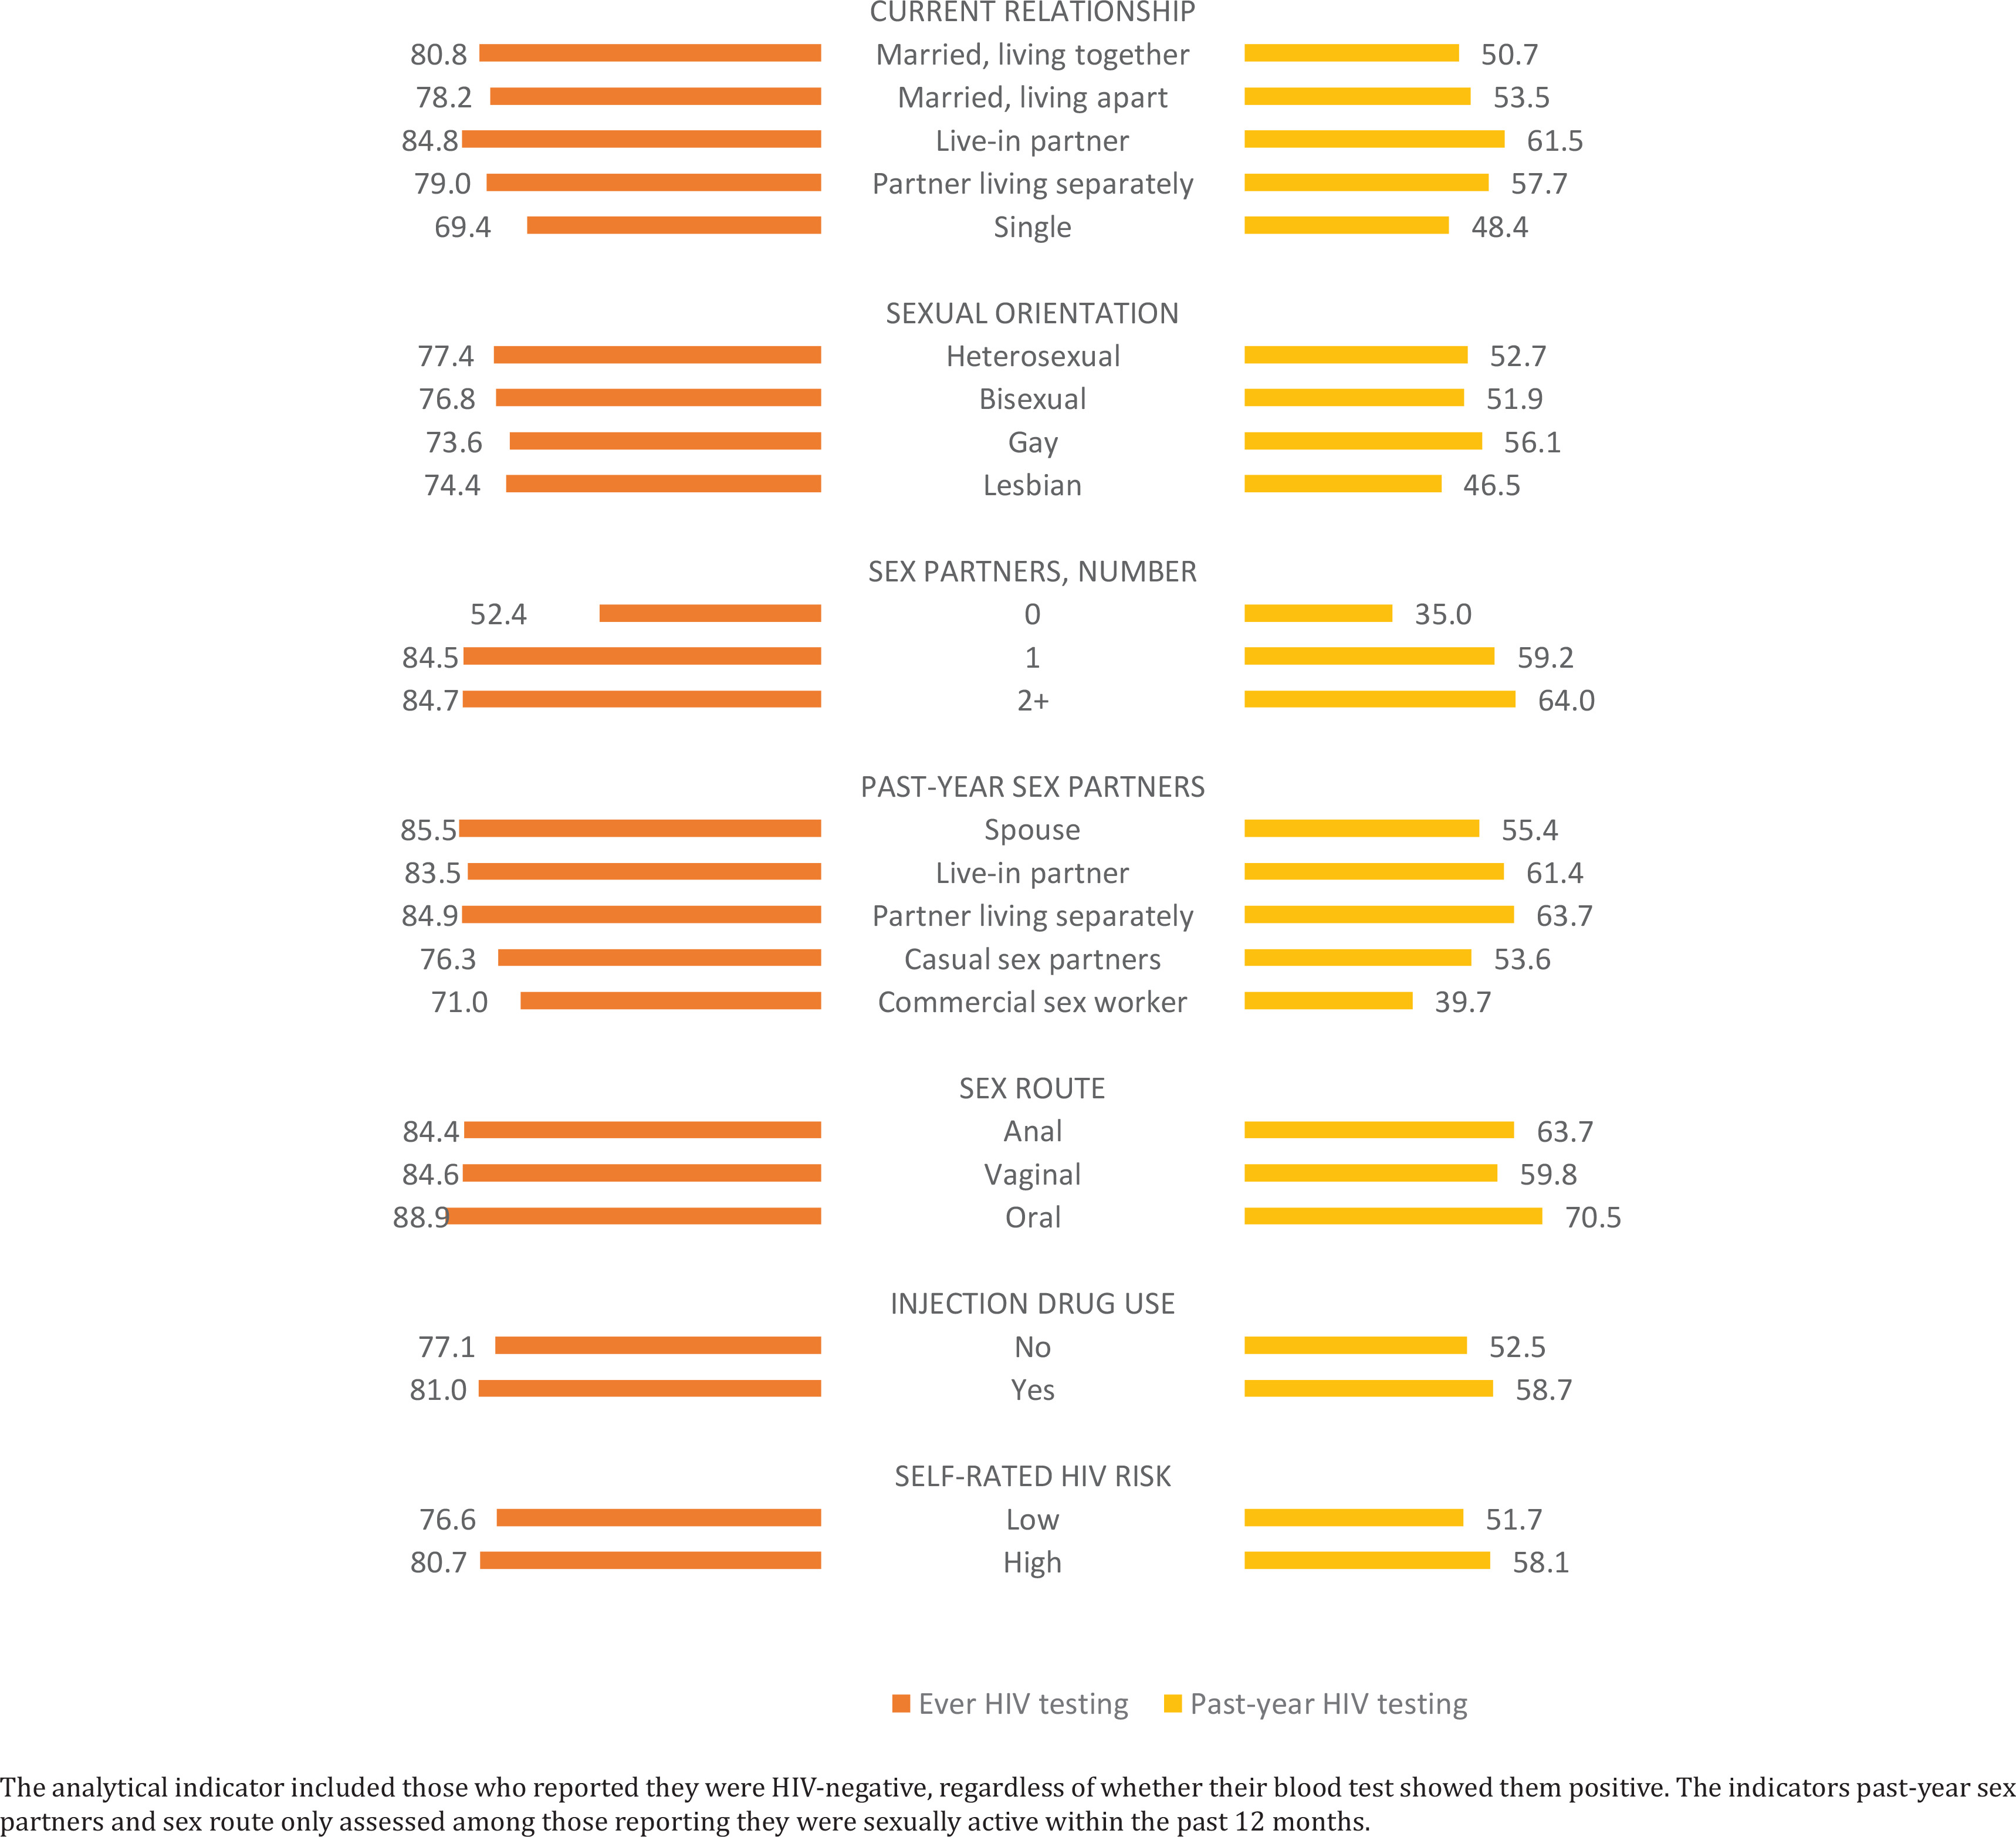
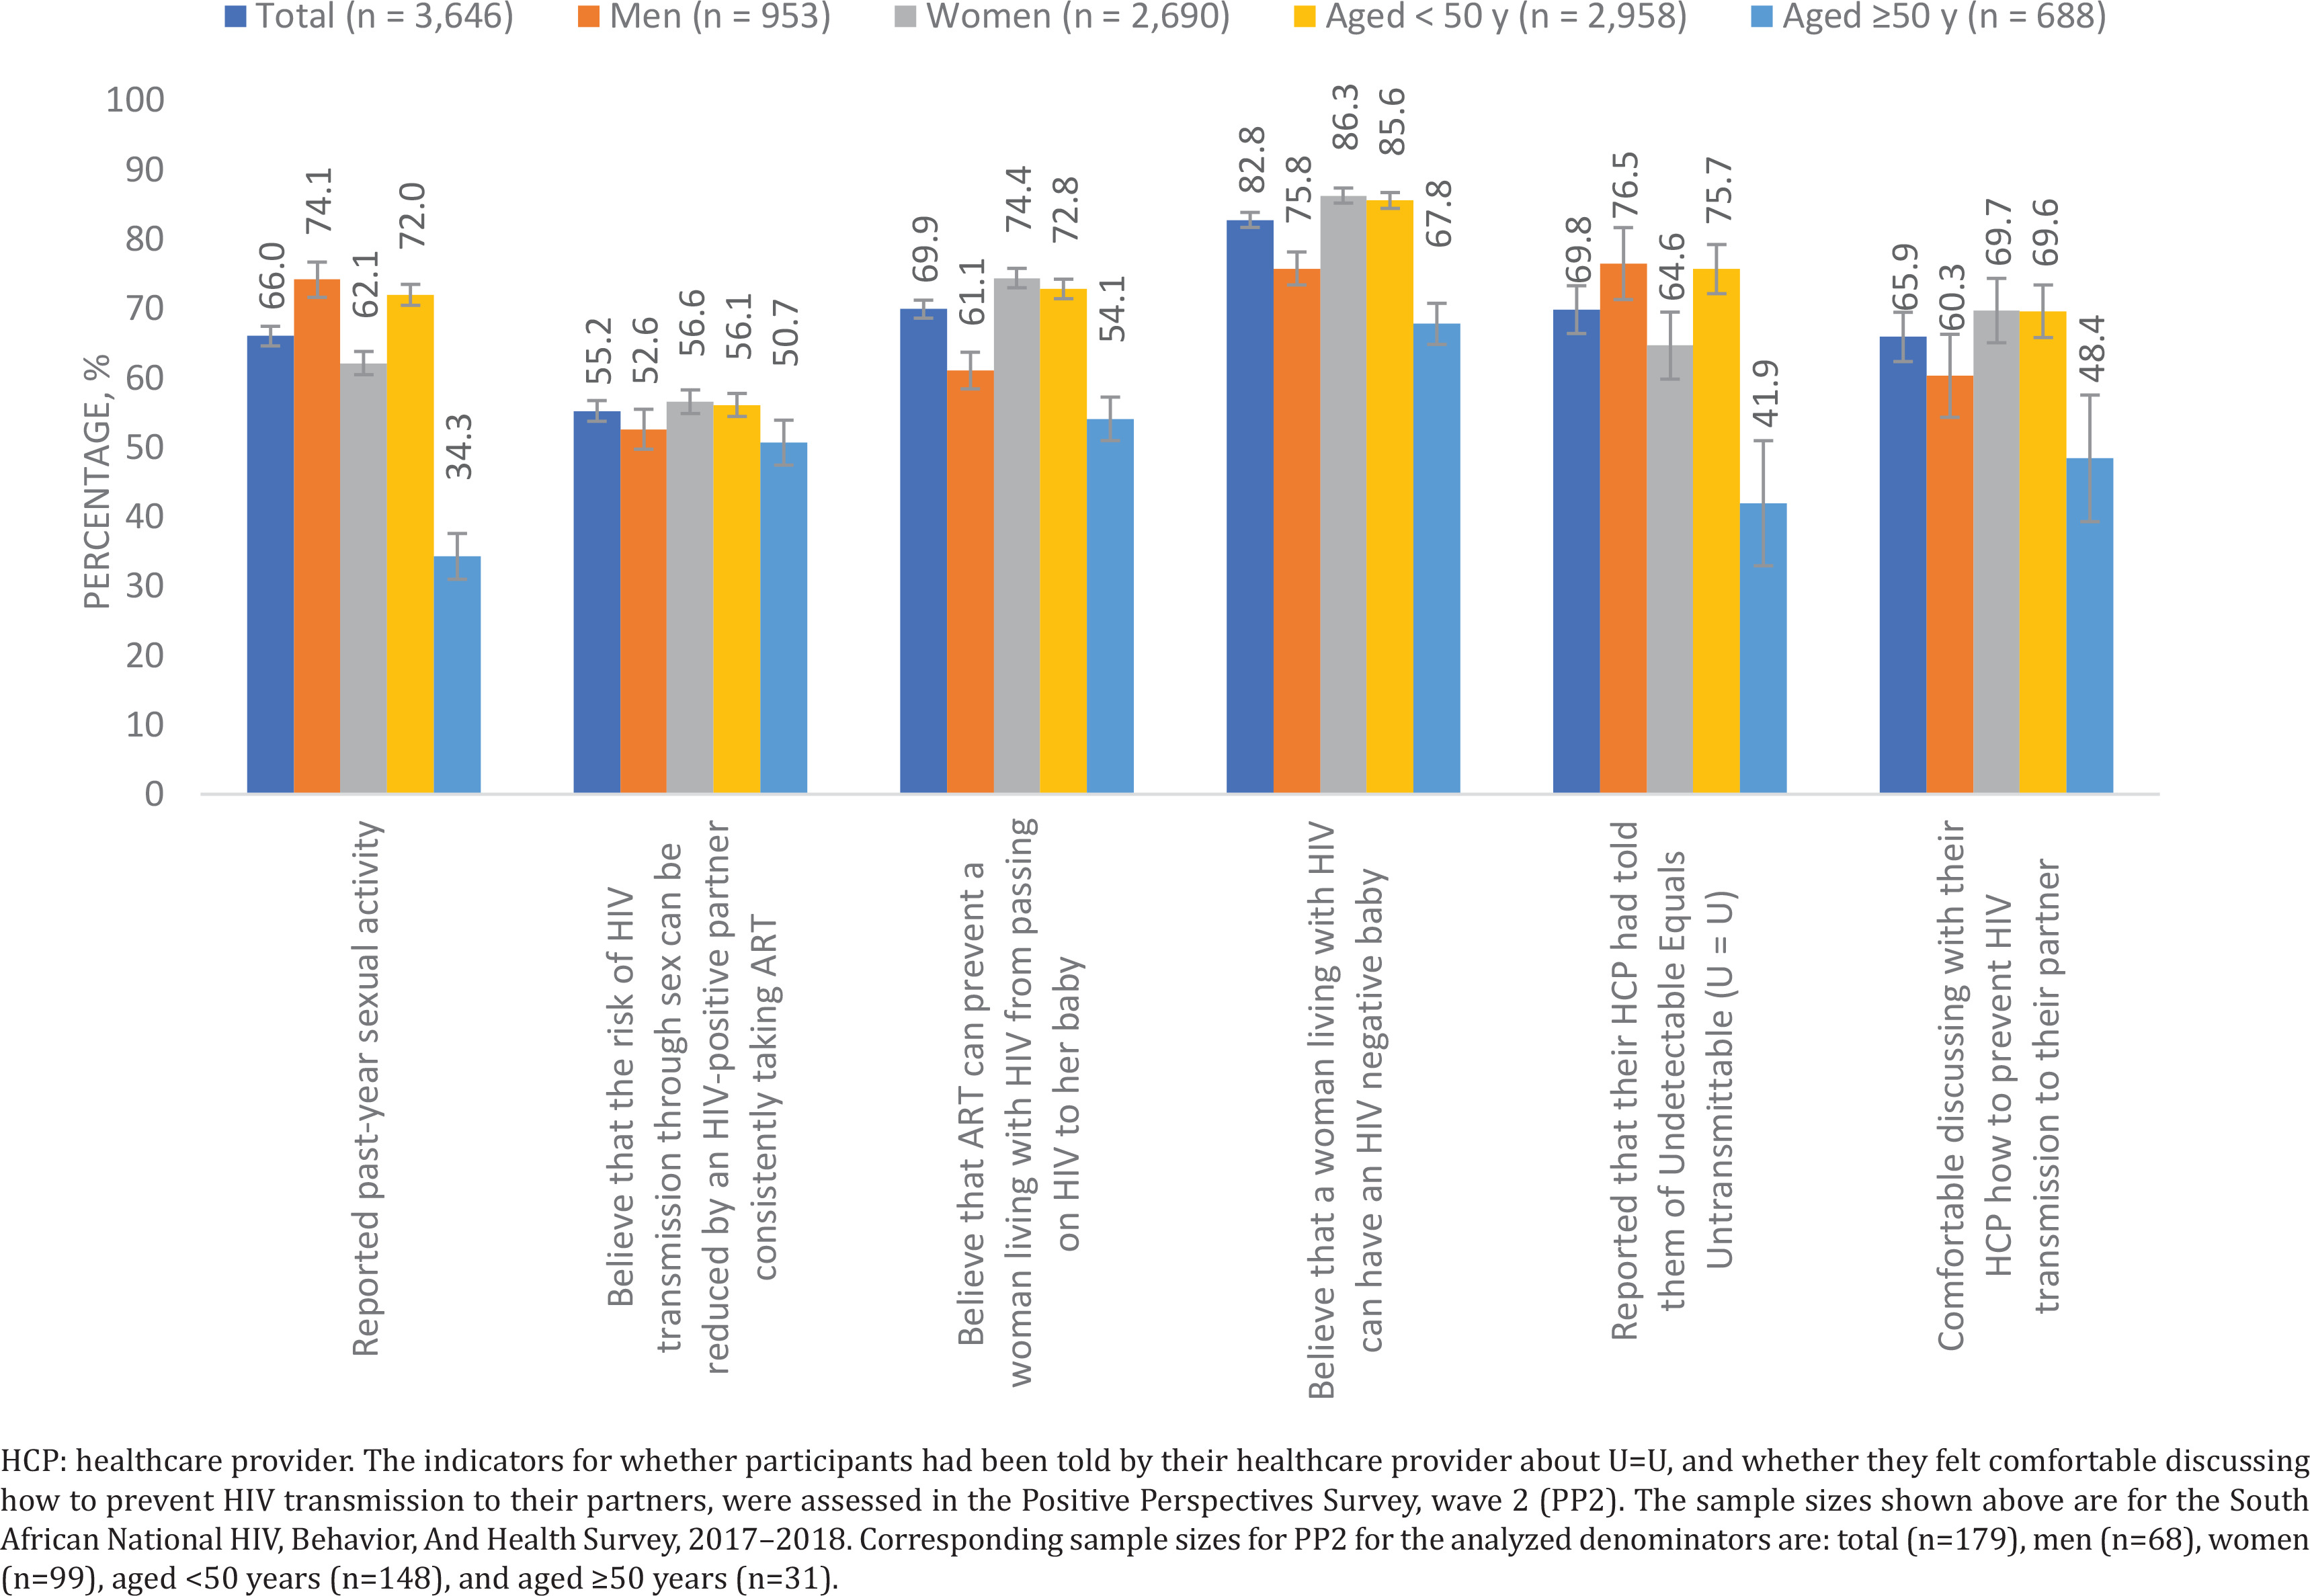
Among individuals reporting they were not living with HIV (regardless of their laboratory-confirmed HIV status), 77.1% reported ever receiving an HIV test, and 52.6% reported past-year HIV testing. As revealed in Figure 1, past-year HIV testing varied among groups at high risk, including those with multiple sexual partners (64.0%), reporting past-year sex with a commercial sex worker (39.7%), engaging in anal sex (63.7%), and reporting injection drug use (58.7%). Among all individuals with a laboratory-confirmed positive HIV test, 66.0% reported past-year sexual activity and this was significantly higher among men than women (74.1% vs 62.1%), and among persons aged <50 years than ≥50 years (72.0% vs 34.3%) (all p<0.05, Figure 2).
Comparison of health-related outcomes among status-aware PLHIV, status-unaware PLHIV, and the non-HIV population
Within SABSSM-V, when HIV status was dichotomized broadly as living with HIV versus not living with HIV, those living with HIV generally reported less favorable health outcomes as shown in Table 2, regardless of whether the dichotomization was based on self-reported or laboratory confirmed HIV status. Within a more nuanced analysis accounting for both laboratory-confirmed HIV infection and self-reported awareness of one’s status, status-unaware PLHIV reported subjective health-related outcomes that were a lot more like the non-HIV population than to status-aware PLHIV (Table 3). For example, self-rated optimal overall health was 82.5% among the non-HIV population, 84.8% among status-unaware PLHIV, and 67.5% among status-aware PLHIV.
Table 2
Comparison of indicators of self-rated health, stigma, and HIV beliefs between the HIV and non-HIV populations, South Africa, South African National HIV, Behavior, And Health Survey, 2017–2018
| Characteristics | HIV status as defined by laboratory testsa | HIV status as defined by self-reportb | ||||
|---|---|---|---|---|---|---|
| HIV-negative (N=13610) | HIV-positive (N=3646) | p | Reported not living with HIV (N=21483) | Reported living with HIV (N=1930) | p | |
| Indicators of self-rated overall and physical health | ||||||
| Optimal overall healthc | 81.0 (79.8–82.1) | 76.7 (74.3–79.1) | 0.001 | 83.1 (82.2–83.9) | 68.1 (64.6–71.5) | <0.001 |
| Non-HIV comorbidityd | 21.9 (20.8–23.0) | 26.7 (24.3–29.2) | 0.0003 | 21.4 (20.5–22.2) | 39.6 (35.9–43.3) | <0.001 |
| Feelings over the past 30 days (mental health) | ||||||
| Tired out for no good reason | 19.5 (18.4–20.7) | 22.8 (20.3–25.3) | 0.0147 | 17.6 (16.7–18.5) | 25.5 (22.2–28.9) | <0.001 |
| Nervous | 14.4 (13.4–15.4) | 17.5 (15.3–19.6) | 0.0079 | 13.2 (12.4–14.0) | 21.7 (18.5–24.9) | <0.001 |
| So nervous that nothing could calm you down | 10.3 (9.4–11.2) | 12.8 (10.9–14.6) | 0.0124 | 9.7 (9.0–10.4) | 15.1 (12.5–17.7) | <0.001 |
| Hopeless | 15.5 (14.4–16.6) | 22.3 (19.9–24.8) | <0.001 | 14.3 (13.5–15.1) | 25.0 (21.7–28.3) | <0.001 |
| Restless or fidgety | 13.1 (12.1–14.1) | 16.0 (13.8–18.1) | 0.0122 | 12.4 (11.7–13.2) | 18.5 (15.5–21.4) | <0.001 |
| So restless you could not sit still | 11.1 (10.2–12.0) | 13.9 (12.0–15.9) | 0.0061 | 10.3 (9.6–11.0) | 15.8 (13.1–18.4) | <0.001 |
| Depressed | 20.7 (19.5–21.9) | 27.1 (24.5–29.7) | <0.001 | 19.4 (18.5–20.3) | 29.7 (26.2–33.2) | <0.001 |
| Everything was an effort | 17.9 (16.7–19.0) | 20.3 (17.9–22.7) | 0.0683 | 16.2 (15.3–17.0) | 24.0 (20.7–27.3) | <0.001 |
| So sad that nothing could cheer you up | 13.2 (12.2–14.2) | 16.3 (14.1–18.4) | 0.0082 | 11.7 (10.9–12.4) | 19.6 (16.7–22.6) | <0.001 |
| Worthless | 10.7 (9.8–11.6) | 14.7 (12.7–16.6) | 0.0001 | 9.8 (9.1–10.5) | 17.8 (14.9–20.7) | <0.001 |
| Indicators of stigma | ||||||
| Would not buy food from a shopkeeper or food seller known to have HIV | 14.8 (13.9–15.8) | 7.6 (6.1–9.1) | <0.001 | 14.5 (13.7–15.2) | 6.2 (4.4–8.0) | <0.001 |
| Would not buy fresh vegetables from a shopkeeper or vendor known to have HIV | 15.3 (14.4–16.3) | 7.8 (6.3–9.3) | <0.001 | 15.2 (14.4–16.0) | 6.2 (4.5–8.0) | <0.001 |
| Not willing to care for a family member with AIDS | 8.0 (7.3–8.7) | 4.3 (3.2–5.3) | <0.001 | 8.5 (7.9–9.1) | 2.4 (1.4–3.4) | <0.001 |
| A teacher with HIV should not be allowed to continue to teach even if they are not sick | 10.0 (9.2–10.8) | 5.3 (4.1–6.4) | <0.001 | 9.8 (9.2–10.4) | 4.0 (2.7–5.4) | <0.001 |
| It is a waste of money to train or give a promotion to someone with HIV/AIDS | 14.0 (13.0–14.9) | 14.0 (11.9–16.1) | 0.9566 | 13.5 (12.7–14.3) | 13.5 (10.8–16.2) | 0.9853 |
| Would want to keep the HIV-positive status of a family member a secret | 64.3 (62.9–65.7) | 70.9 (68.2–73.6) | <0.001 | 66.1 (65.1–67.2) | 70.3 (66.8–73.8) | 0.0325 |
| Comfortable talking to a family member about HIV/AIDS | 12.3 (11.4–13.2) | 9.5 (7.9–11.2) | 0.0063 | 12.2 (11.5–12.9) | 7.9 (5.8–9.9) | 0.001 |
| A person would be foolish to marry a person who is living with HIV/AIDS | 20.8 (19.7–21.9) | 19.2 (16.9–21.5) | 0.2254 | 21.2 (20.3–22.1) | 18.8 (15.7–21.9) | 0.1641 |
| A pupil with HIV should not be allowed to continue to go to school even if they are not sick | 11.0 (10.2–11.9) | 8.1 (6.6–9.7) | 0.0032 | 10.9 (10.2–11.6) | 7.4 (5.4–9.4) | 0.0045 |
| Children living with HIV should not be able to attend school with children who are HIV-negative | 10.3 (9.5–11.1) | 7.5 (6.0–8.9) | 0.0022 | 10.4 (9.8–11.1) | 6.0 (4.2–7.8) | 0.0002 |
| A person can get HIV by sharing food with someone who is living with HIV | 12.2 (11.3–13.1) | 14.1 (12.2–16.0) | 0.0677 | 12.7 (12.0–13.4) | 14.1 (11.6–16.6) | 0.286 |
| U=U beliefs | ||||||
| The risk of HIV transmission through sex can be reduced by an HIV-positive partner consistently taking drugs that treat HIV | 51.5 (50.1–53.0) | 55.2 (52.3–58.2) | 0.0274 | 52.9 (51.7–54.1) | 55.6 (51.8–59.4) | 0.1915 |
| Antiretroviral drugs/treatment (ART) are a treatment for HIV infection and can keep people healthy for a long time | 75.8 (74.6–76.9) | 84.5 (82.6–86.5) | <0.001 | 81.3 (80.4–82.2) | 92.6 (90.7–94.4) | <0.001 |
| Drugs, medicine, pills, or ART can prevent a pregnant woman living with HIV from passing on HIV to her baby (i.e. vertical transmission) | 58.7 (57.3–60.1) | 69.9 (67.4–72.4) | <0.001 | 63.2 (62.1–64.3) | 76.8 (73.6–79.9) | <0.001 |
| Without treatment, HIV can be transmitted from a mother to her unborn baby | 72.2 (70.9–73.6) | 75.4 (72.9–77.9) | 0.0307 | 72.7 (71.7–73.8) | 75.2 (71.9–78.5) | 0.1708 |
| A woman living with HIV can still have an HIV-negative baby | 74.3 (73.0–75.5) | 82.8 (80.6–84.9) | <0.001 | 74.9 (73.9–75.8) | 84.6 (81.9–87.3) | <0.001 |
a Of the 26875 adults aged ≥18 years who completed the questions, 64.3% (n=17256) provided a blood sample for laboratory confirmation of HIV status.
b Self-reported HIV status was defined based on one of the following holding true: 1) respondents indicated they were previously tested for HIV and reported the result of their last test as ‘Positive’; and 2) respondents answered ‘Yes’ when asked ‘Do you currently have any of the following illnesses? – HIV’.
Table 3
Comparison of indicators of self-rated health, perceived stigma, and HIV beliefs between the non-HIV population as well as between PLHIV aware vs not aware of their HIV status, South African National HIV, Behavior, And Health Survey, 2017–2018
| Health-related outcome | Exposure categoriesa | Prevalence | Prevalence ratios |
|---|---|---|---|
| % | APR (95% CI) | ||
| Optimal overall health | Not living with HIV | 82.5 (81.6–83.4) | 1.21 (1.14–1.29) |
| Tested positive but unaware of status | 84.8 (81.9–87.6) | 1.23 (1.15–1.32) | |
| Tested positive and aware of status ® | 67.5 (63.5–71.4) | 1 | |
| Non-HIV comorbidity | Not living with HIV | 20.6 (19.8–21.5) | 0.57 (0.51–0.65) |
| Tested positive but unaware of status | 20.5 (17.3–23.7) | 0.68 (0.57–0.82) | |
| Tested positive and aware of status ® | 37.0 (32.9–41.1) | 1 | |
| Tired out for no good reason in the past 30 days | Not living with HIV | 17.7 (16.8–18.6) | 0.71 (0.61–0.83) |
| Tested positive but unaware of status | 18.7 (15.5–21.8) | 0.74 (0.59–0.92) | |
| Tested positive and aware of status ® | 27.2 (23.4–31.0) | 1 | |
| Nervous in the past 30 days | Not living with HIV | 13.3 (12.5–14.1) | 0.63 (0.53–0.76) |
| Tested positive but unaware of status | 13.6 (11.1–16.2) | 0.62 (0.48–0.80) | |
| Tested positive and aware of status ® | 22.5 (18.8–26.1) | 1 | |
| So nervous that nothing could calm you down in the past 30 days | Not living with HIV | 9.7 (9.0–10.4) | 0.73 (0.59–0.91) |
| Tested positive but unaware of status | 10.9 (8.6–13.1) | 0.75 (0.56–1.00) | |
| Tested positive and aware of status ® | 15.0 (12.0–18.0) | 1 | |
| Felt hopeless in the past 30 days | Not living with HIV | 14.2 (13.3–15.0) | 0.63 (0.53–0.74) |
| Tested positive but unaware of status | 18.3 (15.2–21.4) | 0.73 (0.58–0.91) | |
| Tested positive and aware of status ® | 26.3 (22.5–30.1) | 1 | |
| Restless or fidgety in the past 30 days | Not living with HIV | 12.5 (11.7–13.3) | 0.69 (0.56–0.84) |
| Tested positive but unaware of status | 13.9 (11.2–16.6) | 0.76 (0.58–1.00) | |
| Tested positive and aware of status ® | 18.6 (15.2–22.0) | 1 | |
| So restless you could not sit still in the past 30 days | Not living with HIV | 10.3 (9.6–11.0) | 0.75 (0.60–0.93) |
| Tested positive but unaware of status | 12.5 (9.9–15.1) | 0.84 (0.63–1.12) | |
| Tested positive and aware of status ® | 15.6 (12.6–18.6) | 1 | |
| Depressed in the past 30 days | Not living with HIV | 19.3 (18.4–20.3) | 0.74 (0.64–0.86) |
| Tested positive but unaware of status | 23.2 (19.8–26.5) | 0.80 (0.66–0.97) | |
| Tested positive and aware of status ® | 30.7 (26.7–34.6) | 1 | |
| Everything was an effort in the past 30 days | Not living with HIV | 16.2 (15.3–17.1) | 0.73 (0.62–0.86) |
| Tested positive but unaware of status | 16.6 (13.5–19.7) | 0.69 (0.55–0.88) | |
| Tested positive and aware of status ® | 25.1 (21.3–28.9) | 1 | |
| So sad that nothing could cheer you up in the past 30 days | Not living with HIV | 11.8 (11.1–12.6) | 0.70 (0.58–0.85) |
| Tested positive but unaware of status | 12.7 (10.1–15.4) | 0.66 (0.51–0.86) | |
| Tested positive and aware of status ® | 20.3 (16.9–23.8) | 1 | |
| Felt worthless in the past 30 days | Not living with HIV | 9.8 (9.1–10.5) | 0.62 (0.50–0.76) |
| Tested positive but unaware of status | 11.5 (9.2–13.9) | 0.66 (0.50–0.87) | |
| Tested positive and aware of status ® | 18.0 (14.7–21.3) | 1 | |
| Would not buy food from a shopkeeper or food seller known to have HIV | Not living with HIV | 14.8 (14.0–15.6) | 2.12 (1.51–2.96) |
| Tested positive but unaware of status | 9.2 (7.0–11.4) | 1.62 (1.08–2.43) | |
| Tested positive and aware of status ® | 5.8 (3.9–7.7) | 1 | |
| Would not buy fresh vegetables from a shopkeeper or vendor known to have HIV | Not living with HIV | 15.6 (14.7–16.4) | 2.24 (1.60–3.13) |
| Tested positive but unaware of status | 9.7 (7.4–11.9) | 1.72 (1.15–2.57) | |
| Tested positive and aware of status ® | 5.7 (3.8–7.6) | 1 | |
| Not willing to care for a family member with AIDS | Not living with HIV | 8.6 (8.0–9.2) | 3.93 (2.33–6.63) |
| Tested positive but unaware of status | 6.5 (4.7–8.2) | 3.43 (1.92–6.13) | |
| Tested positive and aware of status ® | 1.8 (0.9–2.7) | 1 | |
| A teacher with HIV should not be allowed to continue to teach even if they are not sick | Not living with HIV | 10.0 (9.4–10.7) | 2.21 (1.50–3.25) |
| Tested positive but unaware of status | 6.5 (4.8–8.2) | 1.68 (1.06–2.65) | |
| Tested positive and aware of status ® | 3.9 (2.4–5.3) | 1 | |
| It is a waste of money to train or give a promotion to someone with HIV/AIDS | Not living with HIV | 13.4 (12.6–14.2) | 0.94 (0.74–1.19) |
| Tested positive but unaware of status | 13.8 (11.0–16.6) | 0.97 (0.72–1.31) | |
| Tested positive and aware of status ® | 14.3 (11.1–17.5) | 1 | |
| Would want to keep the HIV-positive status of a family member a secret | Not living with HIV | 65.6 (64.5–66.7) | 1.00 (0.94–1.06) |
| Tested positive but unaware of status | 72.9 (69.3–76.6) | 1.05 (0.98–1.14) | |
| Tested positive and aware of status ® | 69.0 (64.9–73.0) | 1 | |
| Comfortable talking to a family member about HIV/AIDS | Not living with HIV | 12.3 (11.5–13.0) | 1.43 (1.05–1.95) |
| Tested positive but unaware of status | 11.1 (8.7–13.4) | 1.36 (0.94–1.97) | |
| Tested positive and aware of status ® | 7.8 (5.4–10.1) | 1 | |
| A person would be foolish to marry a person who is living with HIV/AIDS | Not living with HIV | 21.2 (20.3–22.2) | 0.94 (0.77–1.14) |
| Tested positive but unaware of status | 19.8 (16.6–22.9) | 1.02 (0.80–1.30) | |
| Tested positive and aware of status ® | 19.0 (15.4–22.6) | 1 | |
| A pupil with HIV should not be allowed to continue to go to school even if they are not sick | Not living with HIV | 11.0 (10.3–11.6) | 1.47 (1.06–2.03) |
| Tested positive but unaware of status | 9.5 (7.2–11.7) | 1.40 (0.95–2.08) | |
| Tested positive and aware of status ® | 6.8 (4.7–9.0) | 1 | |
| Children living with HIV should not be able to attend school with children who are HIV negative | Not living with HIV | 10.5 (9.8–11.1) | 1.59 (1.12–2.27) |
| Tested positive but unaware of status | 9.2 (7.1–11.4) | 1.66 (1.10–2.52) | |
| Tested positive and aware of status ® | 5.6 (3.7–7.5) | 1 | |
| A person can get HIV by sharing food with someone who is living with HIV | Not living with HIV | 12.6 (11.9–13.3) | 0.84 (0.68–1.05) |
| Tested positive but unaware of status | 13.6 (11.0–16.2) | 0.91 (0.69–1.20) | |
| Tested positive and aware of status ® | 14.8 (11.9–17.8) | 1 |
Prevalence data are given as mean percentage and range. APR: adjusted prevalence ratios. Analyses controlled for age, gender, geographical location, and race.
a Based on agreement between laboratory-confirmed and self-reported HIV status, participants aged ≥18 years were classified into 3 groups: negative laboratory test and negative self-report (i.e. not living with HIV, n=23371); positive laboratory test and negative self-report (i.e. status-unaware PLHIV, n=1912); and positive laboratory test and positive self-report (i.e. status-aware PLHIV, n=1496). We excluded n=96 adults with a negative laboratory test and positive self-report as potential misclassification cases.
Within adjusted analyses using status-aware PLHIV as the reference category in SABSSM-V, the likelihood of optimal self-rated health was higher among both status-unaware PLHIV (APR=1.23; 95% CI: 1.15–1.32) and the non-HIV population (APR=1.21; 95% CI: 1.14–1.29). Conversely, the likelihood of reporting poor emotional wellbeing was lower among both status-unaware PLHIV and the non-HIV population than among status-aware PLHIV. Adjusted prevalence ratios were as follows: nervous (status-unaware PLHIV: AOR=0.62; 95% CI: 0.48–0.80; non-HIV: AOR=0.63; 95% CI: 0.53–0.76); hopeless (status-unaware PLHIV: AOR=0.73; 95% CI: 0.58–0.91; non-HIV: AOR=0.63; 95% CI: 0.53–0.74); depressed (status-unaware PLHIV: AOR=0.80; 95% CI: 0.66–0.97; non-HIV: AOR=0.74; 95% CI: 0.64–0.86); sad (status-unaware PLHIV: AOR=0.66; 95% CI: 0.51–0.86; non-HIV: AOR=0.70; 95% CI: 0.58–0.85); and worthless (status-unaware PLHIV: AOR=0.66; 95% CI: 0.50–0.87; non-HIV: AOR=0.62; 95% CI: 0.50–0.76). Status-unaware PLHIV and the non-HIV population were also more likely to endorse stigmatizing HIV beliefs than status-aware PLHIV, including that they would not buy food from someone with HIV (status-unaware PLHIV: AOR=1.62; 95% CI: 1.08–2.43; non-HIV: AOR=2.12; 95% CI: 1.51–2.96); they would not buy fresh vegetables from someone with HIV (status-unaware PLHIV: AOR=1.72; 95% CI: 1.15–2.57; non-HIV: AOR=2.24; 95% CI: 1.60–3.13); and they would not provide care for a family member with AIDS (status-unaware PLHIV: AOR=3.43; 95% CI: 1.92–6.13; non-HIV: AOR=3.93; 95% CI: 2.33–6.63).
Within PP2 (all respondents being status-aware PLHIV on treatment), participants reported various unmet treatment needs related to confidentiality and stigma (Supplementary file Table 1). Only 30.2% felt comfortable sharing their HIV status, 37.4% felt that taking HIV medicines every day increased the chances of revealing their HIV status, 50.8% had ever hidden/disguised their HIV medication in the past six months, 35.2% would be stressed/anxious if someone saw their HIV medication, and 29.1% had missed ART ≥1 time within the past month because of privacy concerns. Reported reasons for withholding HIV status from others in the past included fear of the following: gossip (57.5%), being treated differently (57.0%), romantic discrimination (48.6%), losing their friends (40.2%), being excluded from activities (38.0%), losing their jobs (17.9%), or even being physically attacked (17.3%). Despite these challenges, 44.7% overall were not comfortable discussing privacy concerns with their main HIV healthcare provider, and 23.1% had not told their general care (i.e. non-HIV) provider about their HIV status. One-fifth of participants endorsed negative beliefs about their future living with HIV, including sentiments they would die prematurely from HIV (20.1%), and that because of HIV, they no longer planned for their old age (19.0%). The daily dosing schedule presented additional challenges and was perceived by some as cueing internalized stigma. For example, 50.8% felt that taking HIV medicines every day reminded them of their HIV. In addition, 22.3% felt their daily dosing schedule was stressful, 20.1% felt it limited their life, and 47.5% were worried about missing an ART dose. Other concerns were about possible weight gain/altered body shape from ART (64.8%), having to take more and more medicines with age (62.6%), long-term negative impacts of treatment (68.2%), and potential drug-drug interactions (48.0%). Overall, 44.1% felt there was room for improving their HIV medications, 40.8% had ever switched ART at least once – most commonly to reduce the number of pills taken daily – and 27.9% overall would prefer not having to take HIV medicines every day. Other treatment-related challenges and experiences are summarized in Supplementary file Table 1.
Subgroup differences were observed among PP2 participants in some of the perceptions indicative of internalized stigma. Older adults aged ≥50 years were more likely to report that they no longer planned for their old age because of HIV than participants aged <50 years (25.8% vs 17.6%). Despite perceiving room for improving their medication to a greater extent (almost 10 percentage points higher, 51.6% vs 42.6%), older adults were less likely (≥10 percentage points lower) than participants aged <50 years to be concerned about some more forward, long-term effects of ART, or to even feel comfortable discussing those issues with their HIV care provider. For example, compared to participants aged <50 years, older adults were less likely to be concerned about the impact of ART on their overall health and wellbeing (38.7% vs 60.8%), and of running out of treatment options in the future (45.2% vs 56.1%). Gender differences were also observed in treatment experiences, anticipated stigma, as well as a willingness to open up to HCPs about treatment challenges or share HIV status with others. Males reported higher prevalence than females (≥10 percentage points higher) for an experience of side effects (48.5% vs 35.4%), perception daily ART dosing was a constant reminder of HIV in their life (58.8% vs 47.5%), difficulty swallowing pills (47.1% vs 29.3%), concern about how ART might impact their health and wellbeing (67.6% vs 50.5%), and concern about the risk of drug-drug interactions (57.4% vs 42.4%). Optimal mental health among males was conversely markedly lower than females (57.4% vs 77.8%). Males, nonetheless, reported lower prevalence than females (≥10 percentage points lower) forever switching their ART (30.9% vs 47.5%), comfort sharing their HIV status with others (20.6% vs 35.4%) or comfort discussing with HCPs a range of issues relevant to their wellbeing, including the impact of ART on their day-to-day life (52.9% vs 67.7%), their emotional wellbeing (54.4% vs 66.7%), side effects (51.5% vs 65.7%), and the long-term impacts of ART (47.1% vs 58.6%). The most common reason for switching ART, among females who switched, was quality-of-life reasons (to reduce the number of pills they needed to take daily, 36.2%), whereas the most common reason among males was a medical indication (viral resistance, 38.1%).
U=U beliefs and stigma perceptions among PLHIV and the non-HIV population
Within PP2, 69.8% of South African PLHIV on ART indicated their HCP had discussed with them U=U (Supplementary file Table 1). Older adults faced a ‘double whammy’ with regard to communication about issues related to HIV transmission within PP2 (Figure 2). Not only were people aged ≥50 years less comfortable than those aged <50 years to discuss with their HCPs concerns about preventing HIV transmission to their partners (48.4% vs 69.6%), but they were also less likely to be told about U=U by their HCPs (41.9% vs 75.7%). Female participants in PP2 were similarly less likely than their male counterparts to be told about U=U by their HCP (64.6% vs 76.5%).
In SABSSM-V, only just over half (55.6%) of those self-reporting they were living with HIV believed that the risk of HIV transmission through sex can be reduced by an HIV-positive partner consistently taking drugs that treat HIV, and this did not differ significantly from individuals reporting not living with HIV (52.9%, p=0.1915). Compared to those reporting not living with HIV, a significantly higher percentage of those self-reporting they were living with HIV, however, believed that ART could prevent vertical HIV transmission (76.8% vs 63.2%, p<0.001) and that a woman living with HIV could still give birth to an HIV-negative baby (84.6% vs 74.9%, p<0.001) (Table 2). Similar results were seen when analyzed among those with objectively confirmed (i.e. laboratory) positive HIV-status as shown in Figure 2.
U=U belief among those reporting that they were living with HIV in SABSSM-V was associated with less likelihood of internalizing stigma and greater likelihood of sharing their HIV status with their sexual partners. For example, the likelihood of endorsing the discriminatory idea that children living with HIV should not be able to attend school with children who are HIV-negative was significantly lower among PLHIV believing than not believing that ART can prevent vertical transmission (APR=0.23; 95% CI: 0.13–0.42), and that a woman living with HIV could still give birth to an HIV-negative child (APR=0.28; 95% CI: 0.14–0.54). PLHIV believing that ART can prevent vertical transmission were also more likely to share their HIV status with their sexual partners than those not believing (APR=1.18; 95% CI: 1.01–1.38, data not shown). U=U belief among PLHIV was also associated with less fearfulness of those with AIDS. The likelihood of refusing to care for a family member with AIDS was lower among those believing that ‘the risk of HIV transmission through sex can be reduced by an HIV-positive partner consistently taking drugs that treat HIV’ (APR=0.38; 95% CI: 0.16–0.92), those believing ART can prevent vertical transmission (APR=0.46; 95% CI: 0.26–0.81), and those believing a woman living with HIV could still give birth to an HIV-negative baby (APR=0.37; 95% CI: 0.16–0.86) (Table 4).
Table 4
Adjusted prevalence ratios with corresponding 95% confidence intervals for the associations between awareness of U=U principles and personal experiences with PLHIV and stigma attitudes among the HIV and non-HIV populations aged ≥18 years in South Africa, South African National HIV, Behavior, And Health Survey, 2017–2018
Among the non-HIV population in SABSSM-V, U=U belief was also inversely associated with stigma sentiments directed at PLHIV (Table 4). Conversely, wrong information about how HIV is transmitted engendered stigma. For example, those who believed HIV could be transmitted by sharing food were more likely than those without this belief to report they would not buy food from a food seller with HIV (APR=1.32; 95% CI: 1.16–1.50), not get fresh vegetables from someone with HIV (APR=1.33; 95% CI: 1.18–1.51), to disapprove of PLHIV teaching in schools (APR=1.38; 95% CI: 1.17–1.63), or of children with HIV attending the same school as children without HIV (APR=1.61; 95% CI: 1.38–1.88), to perceive that promoting or training PLHIV was a waste of money (APR=2.06; 95% CI: 1.82–2.33), or to state that it would be foolish to marry someone with HIV (APR=1.72; 95% CI: 1.56–1.89). Two behaviors that protected against stigma among the non-HIV population were past social interactions with PLHIV and actively learning about HIV. As shown in Table 4, those reporting that they knew someone living with HIV, or that someone living with HIV had shared their HIV status with them, were significantly less likely than those without those experiences, to report HIV stigmatizing sentiments. Similarly, non-HIV individuals who had learned more about HIV in different settings, including workshops, educational events, clinic discussions, or in a community setting, reported less likelihood than those without the respective educational experiences, of reporting HIV stigma sentiments directed at PLHIV.
DISCUSSION
PLHIV aware of their HIV status had poorer self-rated health and reported higher perceived stigma than the non-HIV population. While status-unaware PLHIV showed more favorable subjective measures of emotional wellbeing, similar to levels seen among the non-HIV population, ‘blissful ignorance’ is not a long-term or sustainable solution to stigma. PLHIV who delay knowing or accepting their HIV status may eventually develop very high pretreatment viral loads, a state that predicts poor health outcomes such as the emergence of drug resistance, treatment failure, and disease progression25. This could ultimately reinforce internal stigma because such individuals may never know the benefits of an undetectable viral load. Enhanced and sustained efforts are therefore needed to eliminate HIV stigma in all forms using evidence-based strategies that recalibrate social norms in the society26.
Addressing stigma requires an all-hands-on-deck approach from all stakeholders, including PLHIV, healthcare providers, the non-HIV population, grassroots organizations, as well as governmental and non-governmental agencies26. The role of PLHIV is supported by our study finding that individuals without HIV who reported that someone living with HIV had shared their HIV status with them were less likely to endorse negative, stigmatizing sentiments about PLHIV. The burden of reducing stigma should, however, not fall first and foremost to the victims of stigma but should start with other parties – HCPs, policy makers, and the public, with the inclusion of PLHIV in the discussions around what can be done to support them to feel safe enough to disclose. We observed that individuals without HIV who reported having a discussion with a clinician about HIV were less likely to endorse negative stereotypes about PLHIV, underscoring the role that general care providers also play in eliminating stigma. Our findings, however, suggest much room for improvement in HCP involvement given that nearly 1 in 3 PLHIV in our study reported not being told about U=U by their HCPs, especially females (despite their higher HIV seroprevalence), and older adults aged ≥50 years (despite a third of them reporting past-year sexual activity in our study). With evidence that ART increases life expectancy comparable to that seen in the general population27, and against the backdrop of our finding that 1 in 4 older PLHIV did not expect a normal life expectancy, it is imperative for providers to educate older PLHIV about U=U and how the benefits of being ‘Undetectable’ go beyond being ‘Untransmissible’ to living a longer, healthier life. To accelerate progress towards the 2030 target of eradicating AIDS as a public health threat28,29, it is important to incorporate the U=U message into HIV policies, guidelines, and service delivery within the South African context.
ART-related challenges were associated with internalized stigma within the PP2 sample; many of the challenges with daily oral ART were higher among men than women, as was suboptimal mental health – also associated with stigma. Men were less comfortable disclosing their status to others or opening up to their HCPs about their treatment challenges. For example, despite having a higher prevalence of side effects, males reported a lower prevalence for perceived comfort discussing side effects and several other concerns about their emotional wellbeing with HCPs compared to females. This might suggest an underlying ‘macho’ factor, especially when taken together with other observations such as males being the group with the lowest prevalence of switching ART for ‘mere convenience’ (to reduce number of pills swallowed daily) but reporting the highest prevalence of those switching for ‘intractable’ challenges (viral failure). The high switching on account of viral failure among males could also be that they may be kept on failing regimens longer, which could deny them the benefit of U=U, ultimately reinforcing internal stigma. Individuals identifying with some ‘other genders’ neither male nor female were generally less likely to have many of the concerns around daily oral dosing and were more likely to change ART for side effects or ART simplification, and to be satisfied with their care (including current medications) than other groups/overall. This may possibly be because such individuals may be accessing ART through specialized services catering for other genders and sensitized to them.
Expanding the flexibility of treatment options may be helpful in mitigating internalized stigma among those who feel that daily HIV dosing is a constant reminder of HIV in their lives, as reported by over half of South African participants in PP230. The most common reason overall for switching ART in our study was to reduce the number of pills taken, underscoring the extent to which dosing flexibility and quality of life play a role in treatment choices among PLHIV. Considering the quality of life factors beyond viral suppression and seeking the viewpoint of PLHIV when planning treatment can help address unmet needs and improve health-related quality of life as espoused in the fourth 90 targets19,31.
Strengths and limitations
This study’s strengths include the use of a very large sample and laboratory confirmation of HIV status which enhance the internal and external validity of this study. Nonetheless, there are some limitations. First, the sampling frame of SABSSM-V excluded groups that may have a different risk of HIV, including patients admitted in hospitals, military personnel living in barracks, incarcerated individuals, and homeless people. In addition, SABSSM-V did not assess knowledge of other routes of HIV transmission to a child other than during pregnancy, including during childbirth and breastfeeding. Also, while not a limitation, it should be noted that the construct of ‘awareness’ of HIV status as defined in our article is not synonymous with every diagnosis of HIV status. While only 45.0% of those with a positive laboratory test indicated awareness of their HIV status based on self-report alone, this number doubled when factoring in both self-report and the presence of ART analytes in the blood stream24. The underestimation of diagnosis by self-reports has little relevance to our study though, because our aim was not to estimate the percentage of PLHIV diagnosed but rather to measure the impact that embracing one’s diagnosis has on indicators of stigma and overall wellbeing. Limitations exist to the PP2 study as well; the survey was web-based and may have oversampled individuals of higher socio-economic status. Also, some subgroups in PP2 (e.g. people identifying with some ‘other gender’) had very small sample sizes which may have led to imprecise estimates.
CONCLUSIONS
Just over half (55.6%) of individuals reporting they were living with HIV were aware that ‘the risk of HIV transmission through sex can be reduced by an HIV-positive partner consistently taking drugs that treat HIV’. PLHIV were more familiar with the fact that ART can prevent vertical transmission (76.8%) and that a woman living with HIV can still give birth to an HIV-negative baby (84.6%). Awareness of U=U was associated with significantly less perceived stigma among both PLHIV and the non-HIV population. Given that 1 in 3 of South African PLHIV on treatment reported having not been told of U=U by their HCP, enhanced and sustained efforts are needed to incorporate the U=U message into HIV policies, guidelines, and service delivery in South Africa.