


INTRODUCTION
Tobacco use continues to be a major problem in global public health, with an estimated eight million deaths each year, including a large proportion due to tobacco-related cancers1. Smoking is a major risk factor for chronic obstructive pulmonary disease (COPD) and lung cancer, and significantly increases the risk of cardiovascular disease, including myocardial infarction, stroke, peripheral artery disease, and aortic aneurysm2. In addition, smoking also increases susceptibility to respiratory tract infections and doubles the risk of tuberculosis, and tuberculosis patients who smoke have twice the risk of death3.
Over the past decade, tobacco use in Indonesia has remained a major challenge, with smoking prevalence showing no decline between 2007 and 2014 (30.8% to 31.9%), alongside increased consumption and affordability. These patterns suggest a limited impact of tobacco control efforts and highlight the need to examine determinants of non-smoking behavior4. The World Health Organization (WHO) estimated that the global smoking population would increase from 1.3 billion to 1.6 billion people by 20255. Current data show gender disparities in tobacco use, with the prevalence of male smokers reaching 47% compared to only 12% of female smokers, with 80% of smokers living in low- and middle-income countries6.
Indonesia has the highest rate of male smokers in urban areas in the world. In 2018, approximately 67% of adult men aged ≥15 years were reported to be cigarette smokers, while the prevalence among younger males aged 13–14 years increased to 35.5% in 20197. This certainly places a financial burden on the health system in treating various tobacco-related diseases. A 2015 study in Indonesia reported that 925611 males (93.27%) and 66719 females (6.93%) were hospitalized due to diseases attributable to smoking, including hypertension (42.6%), chronic obstructive pulmonary disease (40.2%), and stroke and other diseases (12%), accounting for 21.05% of all chronic diseases in the country8. In addition, 14.1% of male deaths from non-communicable diseases were caused by smoking9.
In contrast, the increasing consumption of electronic cigarettes hinders tobacco control, mainly because it attracts individuals who have never smoked and triggers respiratory, metabolic, and psychological disorders10. Several challenges of tobacco control stem from the product itself. Moreover, people have been influenced by individual and social characteristics that shape their response to smoking cessation efforts11. Sociodemographic factors such as education, jobs, and socio-economic status (SES) were associated with smoking cessation success. Individuals with lower education and lower economic status were more likely to have lower success rates in smoking cessation programs12.
Many Indonesian adolescent males begin smoking between the ages of 10 and 19 years, a developmental phase when masculine identity formation and the influence of social norms are particularly strong13. This behavior often continues into adulthood and forms long-term smoking patterns, especially in urban environments characterized by social pressure, widespread access to tobacco products, and strong masculinity norms14. As a result, the prevalence of smoking among adult males in urban areas remains high, despite the implementation of various tobacco control policies15.
Indonesia still continues to experience high smoking prevalence of smoking due to the weakness of tobacco control policies compared to other countries. Over the past decade, several national regulations have been implemented (i.e. Law No. 36 of 2009), but they remain insufficient to effectively control tobacco use in communities, particularly in urban settings. Indonesia has yet to ratify the World Health Organization Framework Convention on Tobacco Control (WHO-FCTC)16. Given this situation, controlling tobacco use among adult males remains challenging.
Most previous studies have focused more on behavioral likelihood factors for smoking5. A few limited studies remain that have explored the determinants of non-smoking status among adult males (NSAM) in urban communities5. Understanding the social environments is crucial for developing preventive and sustainable tobacco control strategies focusing on protective factors17. Therefore, this study aimed to determine the prevalence of NSAM and its associated factors in urban areas over a decade (2011–2021) by using two consecutive surveys.
METHODS
Study design and setting
This study was a secondary data analysis that used two waves of the Indonesian Global Adult Tobacco Survey (IGATS) 2011 and 2021 datasets, which are available in the repository databases18. IGATS is a nationwide, cross-sectional survey representing the adult general population aged ≥15 years19. Both surveys used a multi-stage stratified cluster sampling design, which, in principle, allows for the separation of representative samples for urban and rural areas. Data were collected using a standardized questionnaire administered via electronic devices.
IGATS covers a number of information items such as demographic and socio-economic, smoking and cessation efforts, vaping, secondhand smoke, tobacco media, knowledge, and attitudes toward tobacco. Respondents were asked a number of questions whose answers were positive or negative depending on the structure of the question. The response rate was around 94% for those two survey waves. We obtained the data using individual records and extracted the dependent and independent variables after being granted permission through an online request. A STROBE checklist is provided in the Supplementary file.
Study subject
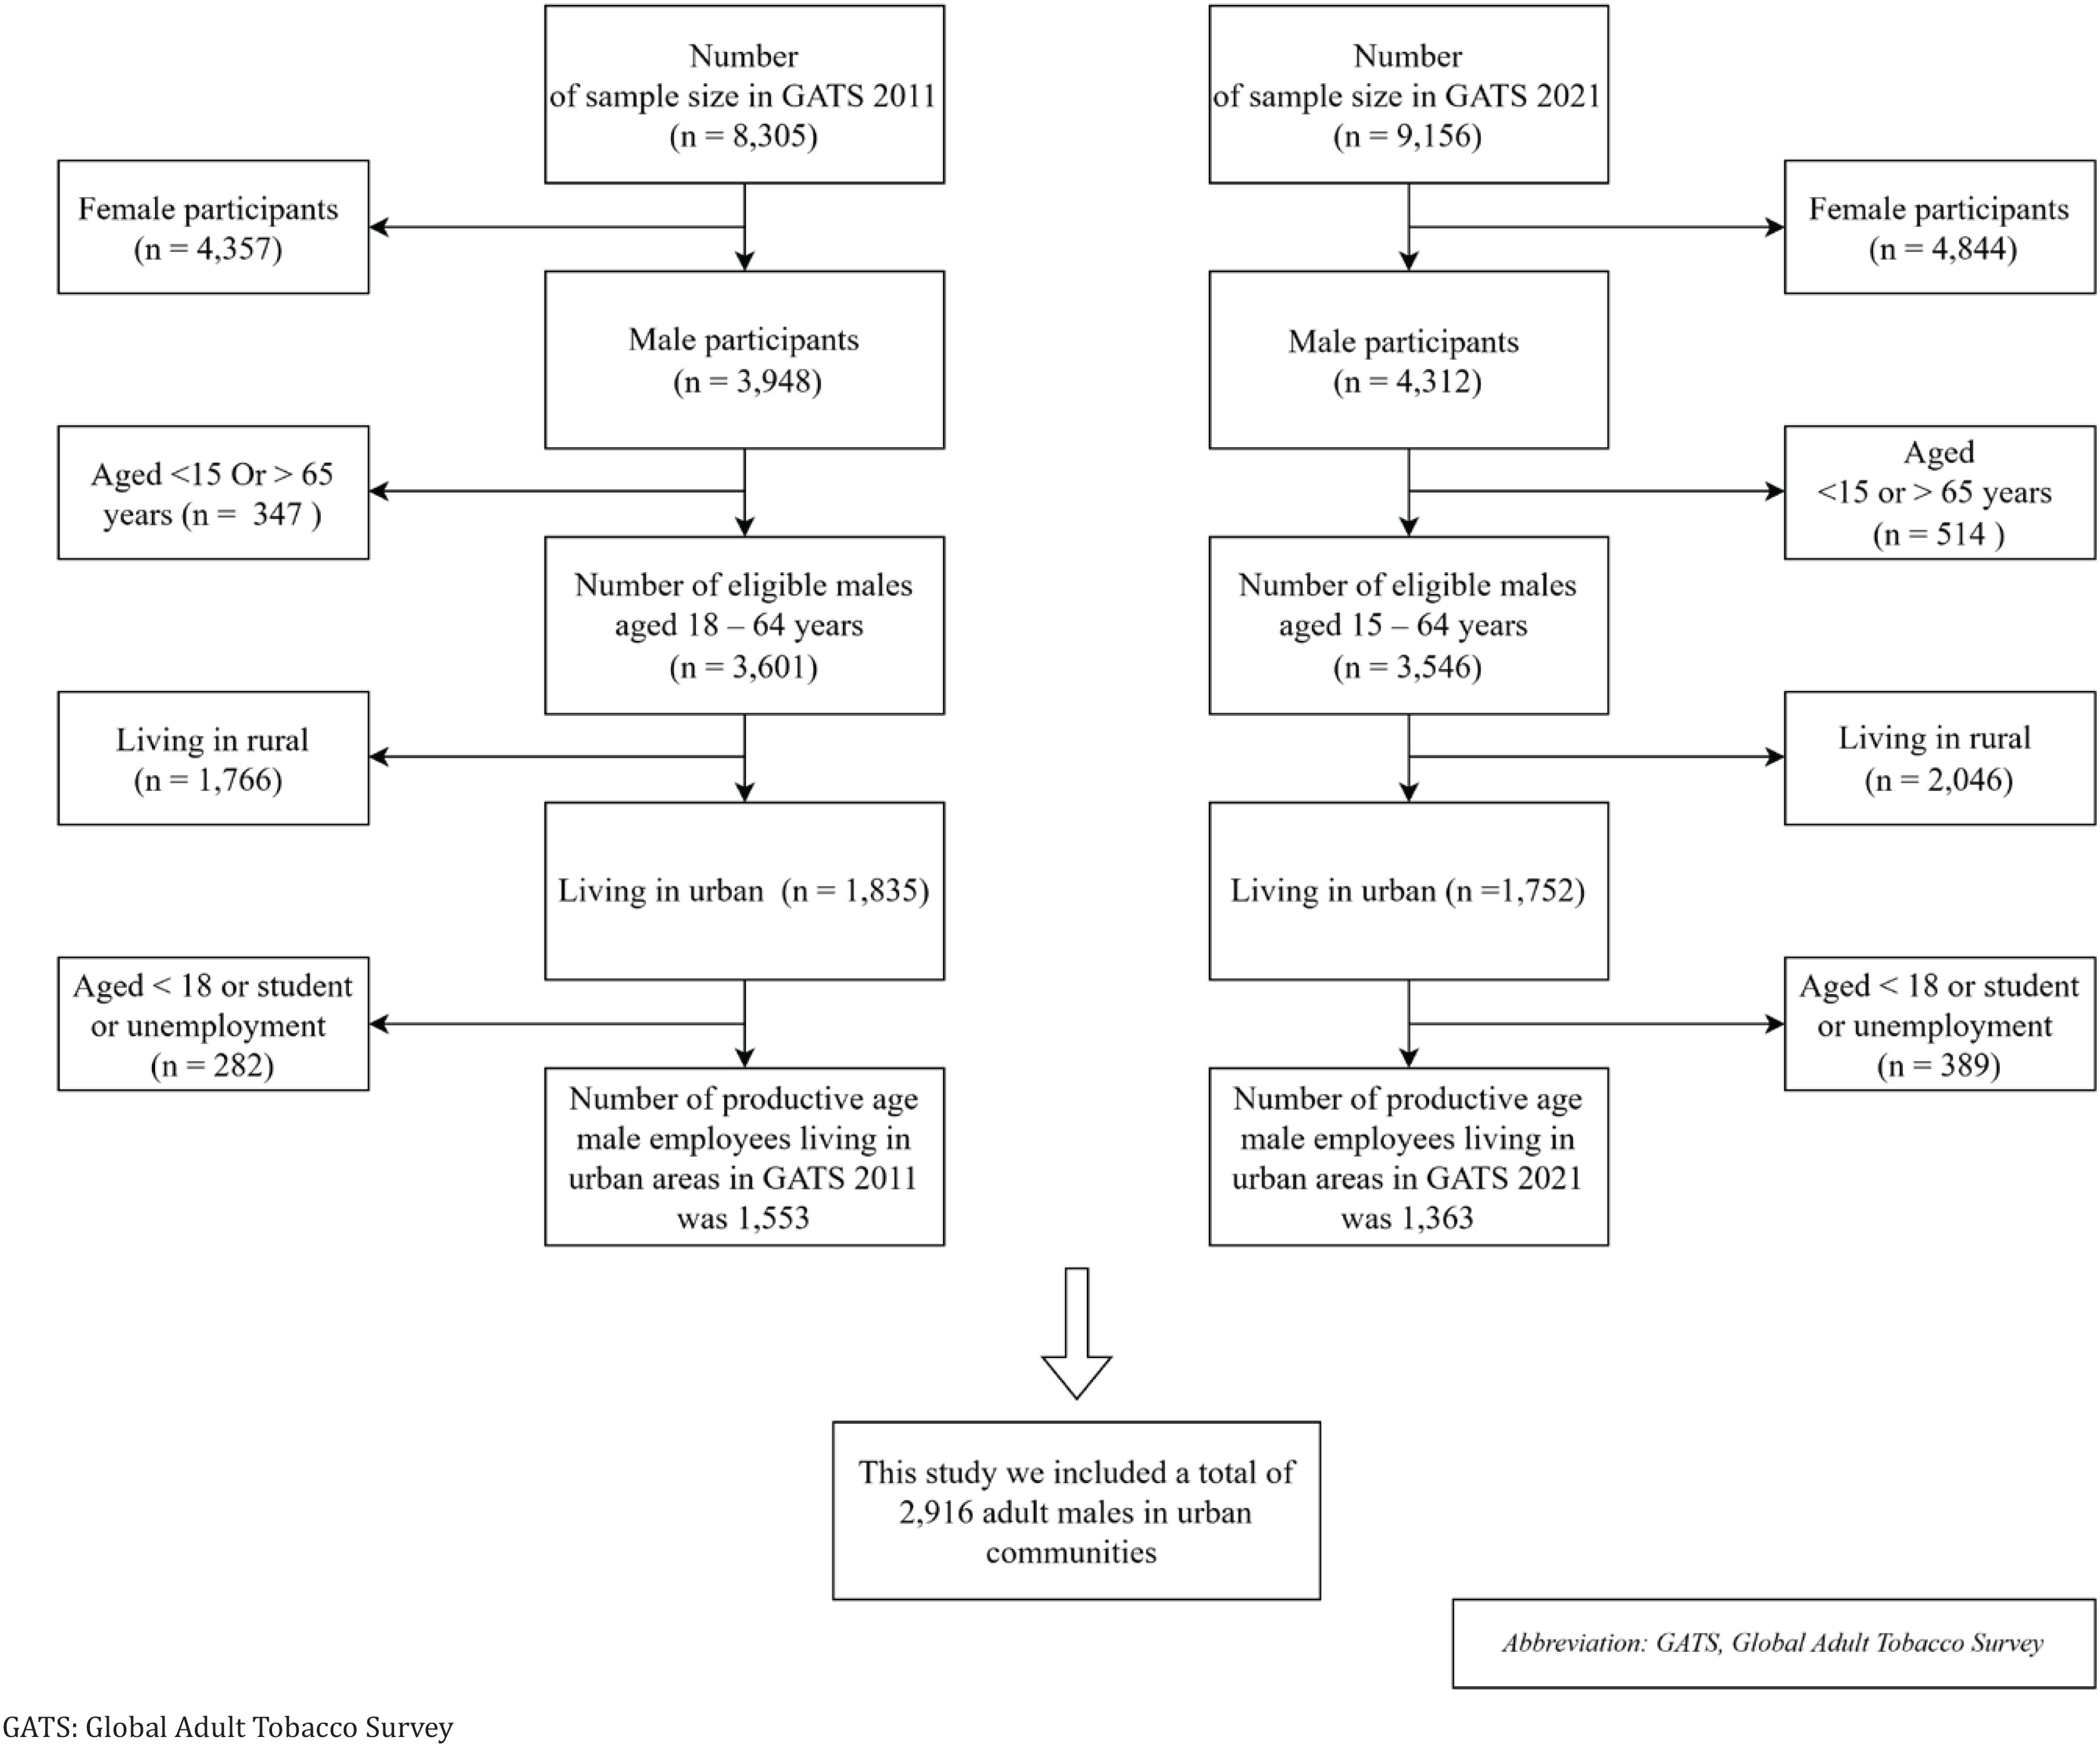
The eligibility and inclusion criteria for the study population were productive-age male employees aged >18 years who lived in urban communities. We excluded school-aged adolescents (aged 15–17 years), students, and the unemployed. Considering the survey weight, a total of 2916 individuals were included in the main analysis, consisting of 1553 and 1363 participants for IGATS 2011 and IGATS 2021, respectively (Figure 1).
Variable and measurement
The primary outcome in this secondary data analysis was NSAM. It was defined as adult males who reported never smoking either conventional tobacco or e-cigarettes at the time of survey initiation. We used three questions to derive NSAM for each consecutive survey: 1) ‘B01 - Do you currently smoke tobacco on a daily basis, less than daily, or not at all?’; 2) ‘B03 - In the past, have you smoked tobacco on a daily basis, less than daily, or not at all?’; and 3) ‘EC2 - Do you currently use electronic cigarettes or any other vaping device on a daily basis, less than daily, or not at all?’. This study categorized NSAM as a binary outcome and coded it as 1 for ‘yes’ and 0 for ‘no’.
Covariates
This study explored several important covariates from the wide range of IGATS variables, including sociodemographic characteristics (FQ-A, FQ-B), media exposure (FQ-G), and cognitive factors (FQ-H) in the standardized questionnaire. Sociodemographic characteristics (i.e. age, education level, occupation, family size, and household wealth index) were selected. Age was categorized into five groups: 18–25, 26–35, 36–45, 46–55, and 56–64 years. Educational level was categorized as uneducated, primary, secondary, and higher education. Occupation was categorized into government employees, non-government, and self-employed. Family size was categorized as small (<5) and large (≥5). The wealth index, calculated on the basis of household asset ownership and living conditions (e.g. electricity and sanitation), was divided into three categories, namely poor, middle, and rich, in accordance with the IGATS standard classification.
Media and cognitive factors were considered as explanatory variables. Media was determined by primary exposure of anti-tobacco media, and it was categorized into television, radio/internet, and billboards. Tobacco Advertising, Promotion, and Sponsorship (TAPS) exposure was categorized as printed, electronic, or a combination of both. Cognitive factors were assessed based on respondents’ level of knowledge regarding the health risks of smoking, measured using a structured questionnaire. The total knowledge score was categorized into low (0–2), moderate (3–4), and high (5–6). Higher scores indicated greater awareness of a healthy lifestyle without tobacco use.
Statistical analysis
Analyses were conducted separately for each wave of the IGATS datasets with weighted data to match the population distribution of NSAM. A sampling weight probability (p-weight) was applied to estimate the population characteristics following multi-stage cluster sampling methods in both surveys. Descriptive statistics were employed to describe the characteristics of NSAM following the independent variables. All respondents were represented using weighted frequencies and percentages, as per the IGATS complex survey design requirements. Chi-squared test for complex survey data was reported to observe different proportions within the NSAM categories for each wave and different proportions between two consecutive surveys. A five percent level of significance was considered to determine a significant difference (p<0.05).
Univariate logistic regression using a survey-weighted design was performed to assess the factors associated with NSAM, considering smokers as a reference category. A crude odds ratio (OR) and 95% confidence intervals (CI) were reported. Variables with p<0.25 in the univariate logistic regression analysis were selected as the candidates for the initial multivariate model following manual stepwise regression. The weighted multivariate logistic regression model was conducted in several stages by retaining variables that showed significant relationships and the magnitude of associations for each covariate. Initially, we included sociodemographic variables related to NSAM by developing a forward stepwise regression. We added significant covariates one by one based on the rank of the magnitude of association from the univariate logistic regression results. The final results of multivariate analysis were presented using adjusted odds ratio (AOR) along with lower and upper bounds of 95% CI. Hosmer and Lemeshow’s goodness-of-fit test was explored to ensure that the final model had a good fit with a p>0.05. All statistical analyses were performed using Stata MP version 17. A p<0.05 was considered statistically significant.
RESULTS
Participants’ characteristics
Among 1553 selected adults in 2011, about one-third of the participants were aged 26–36 years (29.07%), whereas in 2021, a quarter of the participants were of the same age group (23.03%). In 2021, the largest share of respondents was in the age range of 36–45 years (31.41%). From 2011 to 2021, the educational level of respondents underwent significant changes. Respondents with higher education (>49.74%) decreased to 15.09% over time, while respondents with secondary education (>18.24%) increased to 43.48%. More adults in 2021 (45.81%) were working as self-employed than in 2011 (39.61%). Three-quarters of adult males had a small family size (<5 persons) for both surveys.
Considering the wealth index, in 2021, the number of respondents who were classified as poor (39.63%) was higher than in 2011 (31.59%), while respondents who were well-off increased from 25.32% to 32.21%. There were also changes in exposure to anti-smoking advertisements, with exposure through television declining from 24.40% to 10.53%, while exposure through radio increased from 30.57% to 58.18% and exposure through billboards decreased from 45.03% to 31.28% between 2011 and 2021. Participants who listened to the radio increased from 30.57% to 58.18%, and participants who saw advertisements on billboards decreased from 45.03% to 31.28% between the two consecutive surveys. TAPS exposure increased for both media (printed and electronic) usage. The percentage of good knowledge about smoking slightly increased from 28.30% to 31.92% (Table 1).
Table 1
Univariate baseline characteristics of non-smoking status among adult males in urban communities in Indonesia between two consecutive cross-sectional surveys, 2011 and 2021
Prevalence and epidemiology of NSAM
The weighted prevalence of NSAM significantly declined from 20.19% (95% CI: 18.05–22.53) in 2011 to 12.61% (95% CI: 10.89–14.55). Similarly, the prevalence of NSAM among the youngest age group, 18–26 years, significantly declined from 29.49% to 11.85% for the two survey waves. Interestingly, NSAM was consistently found among adult participants in higher education during the ten-year survey period. Moreover, NSAM was decreased by half among the middle group of the wealth index from 22.62% to 10.31%. Printed media exposure declined from 20.28% in 2011 to 11.76% in 2021. Regarding the occupation, the pattern of NSAM prevalence was the same in the two surveys; there was a higher prevalence for self-employed and government staff (Table 2).
Table 2
Sociodemographic, media and cognitive characteristics of participants by non-smoking adult males in Indonesia between two consecutive cross-sectional surveys, 2011 and 2021
| Variables | Survey year 2011 (N=1553) | Survey year 2021 (N=1363) | ||||
|---|---|---|---|---|---|---|
| No n (%)* | Yes n (%) | p | No n (%) | Yes n (%) | p | |
| Age (years) | <0.001 | 0.765 | ||||
| 18–25 | 78.88 (29.49) | 188.60 (70.51) | 26.97 (11.85) | 200.64 (88.15) | ||
| 26–35 | 95.53 (21.16) | 355.95 (78.84) | 43.38 (13.82) | 270.58 (86.18) | ||
| 36–45 | 86.70 (19.84) | 350.35 (80.16) | 47.92 (11.19) | 380.17 (88.81) | ||
| 46–55 | 44.83 (14.92) | 255.65 (85.08) | 40.08 (14.21) | 242.02 (85.79) | ||
| 56–64 | 7.74 (8.02) | 88.77 (91.98) | 13.57 (12.20) | 97.66 (87.80) | ||
| Education level | <0.001 | <0.001 | ||||
| Uneducated | 15.22 (9.01) | 153.73 (90.99) | 13.19 (11.75) | 99.10 (88.25) | ||
| Primary | 37.64 (11.47) | 290.66 (88.53) | 32.30 (7.14) | 419.99 (92.86) | ||
| Secondary | 42.96 (15.17) | 240.29 (84.53) | 70.51 (11.90) | 522.17 (88.10) | ||
| Higher | 217.86 (28.20) | 554.66 (71.80) | 55.91 (27.18) | 149.83 (72.82) | ||
| Occupation | 0.009 | 0.014 | ||||
| Government | 31.76 (27.76) | 82.64 (72.24) | 26.25 (21.39) | 96.46 (78.61) | ||
| Non-government | 181.77 (22.07) | 641.72 (77.93) | 73.65 (11.96) | 542.28 (88.04) | ||
| Self-employed | 100.15 (16.28) | 514.96 (83.72) | 72.02 (11.53) | 552.34 (88.47) | ||
| Family size | 0.307 | 0.091 | ||||
| Small (<5) | 237.37 (19.47) | 981.73 (80.53) | 146.38 (13.66) | 925.06 (86.34) | ||
| Large (≥5) | 76.31 (22.85) | 257.59 (77.15) | 25.54 (8.76) | 266.02 (91.24) | ||
| Wealth index | 0.009 | <0.001 | ||||
| Poor | 97.24 (15.80) | 518.27 (84.20) | 32.77 (7.61) | 397.83 (92.39) | ||
| Middle | 123.13 (22.62) | 421.15 (77.38) | 50.84 (10.31) | 442.53 (89.69) | ||
| Rich | 93.31 (23.73) | 299.90 (76.27) | 88.31 (20.11) | 350.73 (79.89) | ||
| Media anti-tobacco | 0.003 | 0.105 | ||||
| Television | 61.05 (16.11) | 317.89 (83.89) | 12.17 (8.48) | 131.41 (91.52) | ||
| Radio/internet | 124.00 (26.12) | 350.72 (73.38) | 111.38 (14.04) | 681.66 (85.96) | ||
| Billboard | 128.63 (18.39) | 570.71 (81.61) | 48.37 (11.34) | 378.01 (88.66) | ||
| TAPS exposure | 0.585 | 0.358 | ||||
| Printed | 32.76 (20.28) | 128.80 (79.72) | 22.70 (11.76) | 170.35 (88.24) | ||
| Electronic | 31.84 (17.04) | 155.03 (82.96) | 47.33 (15.01) | 268.01 (84.99) | ||
| Printed and electronic | 249.08 (10.68) | 955.49 (73.32) | 101.89 (11.92) | 752.72 (88.08) | ||
| Knowledge of smoking danger | <0.001 | 0.007 | ||||
| Low | 32.93 (9.74) | 305.29 (90.26) | 27.91 (9.46) | 267.18 (90.54) | ||
| Moderate | 163.81 (21.13) | 611.44 (78.87) | 70.83 (11.19) | 561.99 (88.91) | ||
| High | 116.95 (26.61) | 322.59 (73.39) | 73.18 (16.82) | 361.91 (83.18) | ||
The univariate logistic regression analysis showed that the odds ratio of NSAM among the young adult aged group 26–35 years increased between the two surveys (OR=3.08; 95% CI: 1.38–6.85 vs OR=1.31; 95% CI: 0.85–2.04). This study found a similar upward trend among adult males with higher education between the two surveys (OR=3.97; 95% CI: 2.06–7.64 vs OR=4.85; 95% CI: 0.99–7.87). Adult males who worked as government staff showed a higher likelihood of being NSAM compared to those who were self-employed (OR=1.98; 95% CI: 1.19–3.28 vs OR =2.09; 95% CI: 1.24–3.51) for the 2011 and 2021 surveys, respectively. In addition, for two factors: family size was not significantly associated with NSAM, whereas anti-tobacco media of using billboards was also not significant for both surveys (Table 3).
Table 3
Univariate logistic regression of factors associated with overall non-smoking adult males in urban communities in Indonesia for both survey years, 2011 and 2021
This study also explored factors associated with NSAM, including TAPS exposure and knowledge of smoking danger. For both datasets, higher levels of knowledge about smoking danger were more likely to have NSAM than those who had lower knowledge (OR=3.36, 95% CI: 2.07–5.45 in 2011, OR=1.94; 95% CI: 1.20–3.12 in 2021). Interestingly, the trend of TAPS exposure was similarly found to not to be associated with NSAM during the ten-year survey period. Consistent across both survey years, exposure to anti-smoking messages through television and billboards was not significantly associated with non-smoking status.
Factors associated with NSAM by multivariate logistic regression
Following the result of multivariate logistic regression, NSAM was more likely to be observed among participants with higher levels of education compared to those with primary education as the reference category (AOR=2.27; 95% CI: 1.59–3.23) for 2011 and (AOR=3.40; 95% CI: 1.95–5.91) for 2021 (Table 4). Similarly, participants who had good knowledge about smoking danger were more likely to be NSAM compared to those with low knowledge as the reference category, with approximately twice the odds (AOR=2.09; 95% CI: 1.09–3.99) for 2011 and (AOR=1.68; 95% CI: 1.09–2.59) for 2021.
Table 4
Multivariate logistic regression of factors associated with overall non-smoking adult males in urban communities in Indonesia for both survey years, 2011 and 2021
Moreover, the lower wealth index was a significant factor and positively associated with NSAM (AOR=1.41; 95% CI: 1.01–1.97) for 2011. In contrast, higher wealth index was positively associated with NSAM (AOR=1.74; 95% CI: 1.07–2.84) in the 2021 survey. Younger age and anti-tobacco media were positively associated with NSAM compared to those who were not, which were the only significant factors for the 2011 dataset. On the other hand, exposure to TAPS through electronic media was significantly associated with NSAM in 2021 (AOR=1.51; 95% CI: 1.01–2.26; p=0.043) (Table 4).
DISCUSSION
This study showed that a declining proportion of NSAM was observed in Indonesia during the ten-year survey period. It indicated that smoking behavior was still deeply rooted among males in their adult years. In addition, differences in baseline characteristics between 2011 and 2021 suggest shifts in the population composition that may have influenced the observed outcomes.
Changes in the proportion of individuals aged 26–35 years may have contributed to these differences, as this age group is typically in a highly productive life stage characterized by greater social interaction, work-related stress, and increased exposure to environments that promote smoking, including peer influence and tobacco marketing20. The decline in highly educated respondents among non-smokers may have influenced the observed outcomes. Although higher education is often linked to better health literacy, this decrease suggests that educational advantage alone may not be sufficient to sustain non-smoking status among urban adult males, particularly in contexts where occupational stress, social norms, and tobacco exposure remain strong21.
Furthermore, changes in the proportion of individuals in the poor category may have influenced the observed outcomes. In some settings, declines in smoking prevalence are slower among lower socio-economic groups compared to more affluent populations, potentially exacerbating health inequalities and contributing to variations in non-smoking status between survey years12.
This pattern was consistent with study findings in various Asian countries, where smoking prevalence among adult males remains high despite the implementation of tobacco control policies22. Research in various countries showed that urbanization, increased work pressure, and easy access to tobacco products can reduce the effectiveness of tobacco control policies. Working pressure in urban environments has the potential to reinforce smoking habits23.
Sociodemographic characteristics, particularly education and economic status, were associated with NSAM behavior. These two factors influenced how people process and understand information and make decisions related to healthy living behaviors24. Indeed, successful smoking cessation requires social support, a conducive environment, freedom of health information access, and tobacco control regulations25.
In both surveys, the strongest predictor of NSAM was education level. Adult males with higher levels of education and more stable employment were less likely to smoke than those with lower levels of education and unstable jobs, a finding consistent with previous studies showing that socio-economic advantage is associated with lower smoking prevalence26. This evidence was similar to global findings that education can improve health literacy, risk perception, and response to anti-smoking advertisements27. As for young adults and adolescents, previous research showed that education and the existence of a supportive family context might contribute to sustained non-smoking28.
The economic status was observed as an important risk of NSAM since users in richer groups tend to quit smoking compared to poorer groups. This evidence was in line with previous studies, which have stated that higher economic status might be associated with more organized work roles, lower stress levels, and more restrictions on smoking in the workplace23. This shift is likely influenced by increased health awareness, the strengthening of tobacco control policies, and better access to health information among higher socio-economic groups29. Furthermore, lower socio-economic groups tend to face financial, social, and structural barriers when attempting to quit smoking, meaning that behavioral change in this group occurs more slowly12. Individuals with lower socio-economic status sometimes become smokers as a coping mechanism or maybe in situations where their social environment is more liberal.
Having a good knowledge and awareness of the health effects of smoking through health warnings and media campaigns can encourage smoking cessation efforts and reduce tobacco consumption29. This statement was consistent with a systematic review, which suggested that knowledge of the risks associated with tobacco use is inversely related to the likelihood of starting smoking, as well as the likelihood of switching from a non-smoker to a smoker30. Prior studies on e-cigarette users showed that the higher the health literacy, the more critical individuals are of tobacco promotion and the more likely they are to be smoke-free10.
There was a shift in age-related patterns, whereby the younger age group, which in 2011 had been predominantly in the non-smoking category, showed an increased proportion of smokers in 2021. This change was likely influenced by increased exposure to tobacco promotion through digital media, easier access to tobacco products, and the expansion of electronic cigarettes, which were perceived as safer and more modern31. Marketing strategies that associate cigarettes with lifestyle and social identity were considered to increase the vulnerability of younger age groups, which indicated that tobacco control efforts need to be more adaptive to the evolving dynamics of marketing and new products targeting this generation31.
A shift was also evident in the role of the media in shaping non-smoking behavior. In 2011, radio was more closely associated with non-smoking tendencies, reflecting the dominance of conventional media in the dissemination of health information32. However, in 2021, the internet became a more prominent channel as digitalization increased in urban areas. Digital platforms not only expand access to anti-smoking campaigns but also serve as the primary space for electronic TAPS. Interestingly, exposure to TAPS does not always encourage consumption in certain contexts; the intensity of promotion can actually increase awareness of the tobacco industry’s marketing strategies and trigger critical attitudes, thereby reinforcing the decision to remain non-smokers33.
The challenges of quitting smoking among male employees in urban areas are complex and involve various interrelated factors. Nicotine dependence, work pressure, a workplace culture that still tolerates smoking, and limited access to smoking cessation services are the main obstacles34. This situation is further exacerbated by social practices that make smoking a part of social interaction. Research is needed to understand the complex factors affecting smoking among urban males, especially in relation to their workplace exposure to digital tobacco marketing33.
In Indonesia, these challenges can also be linked to the implementation of tobacco control programs, such as the use of pictorial health warnings on cigarette packaging and the provision of smoking cessation services in healthcare facilities35. These interventions play a role in raising awareness of the dangers of smoking and supporting smoking cessation efforts, although their effectiveness may vary across socio-economic groups due to differences in access to information and healthcare services.
Future directions and policy implications
Globally, the MPOWER framework emphasizes the importance of comprehensive policies, including advertising restrictions, smoke-free areas, and smoking cessation support36. In Indonesia, factors such as the non-ratification of the Framework Convention on Tobacco Control (FCTC), limited regulation of tobacco advertising, and challenges in implementing smoking-free policies may be associated with the high prevalence of smoking among urban males, particularly among employees16. Further studies are needed to explore how these factors influence smoking patterns in this population.
This study highlights the potential of a multisectoral perspective in understanding smoking behavior among adult males, encompassing factors related to education, workplace environments, and exposure to digital health information5. With respect to quitting smoking, an effective strategy must also address the characteristics of sociodemographics and economic status, which closely influence smoking behavior among adult males. Further studies are needed to clarify the pathways and strengthen evidence for tobacco control efforts among urban male populations.
Public health interventions should effectively stop smoking behaviors for current smokers and prevent smoking initiation among adult males by implementing an integrated approach of policy regulation, workplace-based programs, the use of digital platforms, mass media campaigns, and smoke-free areas36. Furthermore, future strategies should give priority to interventions among male employees through peer support.
Strengths and limitations
This research has several key strengths. First, the analysis used two nationwide surveys conducted over a decade, allowing the evaluation of temporal changes in non-smoking behavior patterns at the population level. Second, the study specifically focused on adult males living in urban areas, a group with a high prevalence of smoking and complex social dynamics, thus making a more targeted contribution to the tobacco control literature. Third, this study has highlighted sociodemographic characteristics, such as education and economic status, which provide a deeper understanding of the structural determinants of non-smoking behavior. In addition, the involvement of cognitive factors, including media exposure, TAPS, and knowledge levels, has enriched the analysis of how the information environment influences decisions for NSAM in urban communities.
However, this study has limitations. The limitations include the cross-sectional nature of the GATS data. The use of self-reported measures may introduce information bias and potential misclassification. Even though this study used two national-scale data sets over a decade, the analytical framework used was still limited to two main groups of variables, namely sociodemographic characteristics as well as media and cognitive factors. Thus, the pre-existing variables were not fully representative of all the determinants that have the potential to affect non-smoking status in adult males (NSAM). Several other factors that are conceptually and empirically relevant, such as aspects of smoking cessation, more detailed economic conditions, psychosocial factors, as well as the characteristics of the work environment and community, have not been covered in the analysis and need to be explored in further research. In addition, in the context of urbanization and the acceleration of digitalization, the media and TAPS variables in this study may be prone to residual confounding and therefore may not fully explain the reasons for NSAM. This suggests that the relationship between media exposure and TAPS to NSAM behavior may be more complex than this study has been able to include.
CONCLUSIONS
This study has indicated that over the past decade, the proportion of adult males in urban Indonesia who abstain from smoking has decreased, indicating that the public health burden caused by tobacco has worsened. The primary reasons for non-smoking can most probably be linked to sociodemographic factors, and in particular, the level of education and the economic position of the non-smoker. As well as anti-smoking messages, knowledge of the risks of smoking reinforces healthy behavior.