

INTRODUCTION
Tobacco use is one of the most well-established and preventable causes of disease and premature mortality worldwide1. India bears a disproportionate share of this burden, ranking second globally in both tobacco production and consumption2. Tobacco use results in approximately 1.35 million deaths annually in the country and imposes a substantial economic burden, with tobacco-attributable healthcare costs and productivity losses among adults aged ≥35 years estimated at US$85.6 billion3,4.
Recognizing the magnitude of the tobacco epidemic, the World Health Organization Framework Convention on Tobacco Control (WHO FCTC) provides a comprehensive global framework for tobacco control5. As a signatory, India has implemented multiple policy and legislative measures, including the Cigarettes and Other Tobacco Products Act (COTPA), the National Tobacco Control Program (NTCP), the Prohibition of Electronic Cigarettes Act (PECA), national cessation services, digital mCessation initiatives, and taxation policies6-9. Despite these efforts, tobacco use remains widespread, with an estimated 267 million users aged ≥15 years, and marked gender differences in prevalence10.
India is a multicultural nation with one of the largest tribal populations globally, encompassing a diverse array of ethnic groups and civilizations. According to the 2011 Census, Scheduled Tribes (STs) comprise approximately 104 million individuals, accounting for 8.6% of the country’s total population11. India is home to 705 recognized tribes, including several classified as Particularly Vulnerable Tribal Groups (PVTGs)12. Nearly 90% of the tribal population resides in rural areas, with the remaining 10% living in urban settings12. The majority of tribal populations reside in rural, geographically isolated regions, characterized by socioeconomic disadvantage, limited access to education, and restricted access to health services13. These structural inequities are compounded by distinct cultural norms and traditional practices that strongly influence health behaviors, including tobacco use13.
Literature suggests that the use of tobacco among Indian tribal communities is higher compared to the non-tribal population, especially for smokeless and locally prepared tobacco products14,15. However, nationally representative evidence examining the tobacco use behaviors among tribal men and women remains limited. In particular, the role of household and familial contexts, especially spousal tobacco use, in shaping individual tobacco consumption has not been adequately explored in tribal settings, despite evidence from other populations indicating that spousal behavior can be a key determinant of tobacco initiation, continuation, and cessation16. The aim of this study is to assess the gender differences and spousal associations of tobacco usage among tribals residing in India.
METHODS
Data source and study design
This is a secondary dataset analysis of cross-sectional data from two nationally representative consecutive rounds of the National Family Health Survey, NFHS-4 (2005–2006) and NFHS-5 (2019–2021), in India. It included all the states and Union Territories of India for a representative population17,18. Both surveys employed a multistage, stratified cluster sampling design, using probability proportional to size (PPS) sampling to ensure representativeness across states and union territories. Detailed sampling methodologies are available in the NFHS survey report and summarized elsewhere19.
The analysis was based on three NFHS datasets: the Individual Recode (IR) dataset (women aged 15–49 years), the Men’s Recode (MR) dataset (men aged 15–54 years), and the Couples Recode (CR) dataset (matched records of currently married couples). All individuals with complete data on tobacco use, Scheduled Tribe (ST) status, and covariates were included. Respondents with missing data on key variables were excluded from multivariable analyses. Separate analyses were performed for NFHS-4 and NFHS-5 to assess the prevalence during the two surveys.
Study variables
Dependent variable
The primary outcome was a composite categorical variable constructed by cross-classifying respondents by tribal status (Scheduled Tribe vs non-Scheduled Tribe) and current tobacco use (yes, no), yielding four mutually exclusive categories. Details of variable construction are described in the Supplementary file.
Independent variables
Independent variables included key sociodemographic and behavioral factors such as age, education level, wealth index, religion, residence location, geographical zone, media exposure, pregnancy status (self or spouse, as applicable), and respondent drinking alcohol, spouse using alcohol or tobacco, and if spouse tried to quit smoking or tobacco in the past 12 months. Geographical zones were categorized into six regions (North, Northeast, Central, East, West, and South) based on the States Reorganization Act of 1956. Detailed coding and categorization of all variables are provided in the Supplementary file. These variables were selected on the basis of available literature on tobacco use and spousal behavior. Sociodemographic factors were included as potential confounders based on established associations with tobacco use20-23. All variables were categorical, and further details are given in the Supplementary file. None of these variables was found to be confounding based on preliminary assessment and model diagnosis.
Statistical analysis
All analyses accounted for the complex survey design using Stata® MP version 18 (StataCorp, College Station, TX). Datasets were analyzed using the svy command, with primary sampling units, strata, and sampling weights in accordance with NFHS guidelines. Descriptive statistics were used to summarize sample characteristics. Distribution of tribals as per sociodemographic variables and behavior are presented as weighted proportions. Design-adjusted chisquared tests were used to assess bivariate associations between categorical variables. Multinomial logistic regression models were derived to estimate the odds of belonging to each of the four outcome categories, using non-tribal tobacco users as the reference group. Separate models were run for women (IR dataset), men (MR dataset), and couples (CR dataset). Reference categories for the independent variables in the multinomial logistic regression analysis were: 45–49 years, higher education, the richest wealth quintile, the Hindu religion, urban residence, no media exposure, and the South zone, and the reference category for the dependent variable was Non-Tribal Tobacco users. Further, the reference category for all behavioral factors was ‘No’. Consequently, unadjusted ratios (ORs) and adjusted odds ratios (AORs) with 95% confidence intervals (95% CIs) were calculated, and a two-tailed p<0.05 was considered statistically significant. Separate analyses were performed for men and women during NFHS-4 and NFHS-5, and compared.
Variable inclusion was guided by four converging principles applied jointly, the first being prior epidemiological evidence, ensuring that established confounders were retained regardless of their univariate p-value, in order to minimize residual confounding. Second is the conceptual relevance to recognized pathways linking tribal identity to tobacco use, such as socioeconomic position, structural exposure, behavioral co-occurrence, and information environment. Third being observed associations in the unadjusted analyses, with the explicit caveat that variables were not removed solely because particular outcome categories or sub-strata were non-significant, since multinomial models permit a covariate to influence different categories to different degrees; and fourth being the comparability across survey rounds that is the same harmonized covariate structure was retained in the corresponding NFHS-4 and NFHS-5 models for each dataset, so that any temporal differences in adjusted estimates would reflect genuine epidemiological change rather than inconsistent model specification. Maps illustrating the geographical distribution of tobacco use among tribal populations were generated using QGIS® Desktop 3.30.1.
Ethical considerations
The NFHS surveys received ethical clearance from the Ethics Review Board of the International Institute for Population Sciences (IIPS), Mumbai, and relevant national authorities. The surveys were conducted in accordance with established ethical guidelines and regulations. The datasets used in this study were obtained through permission from the Demographic and Health Surveys (DHS) program. As this study is based on publicly available, de-identified NFHS data, no additional ethical approval was required.
RESULTS
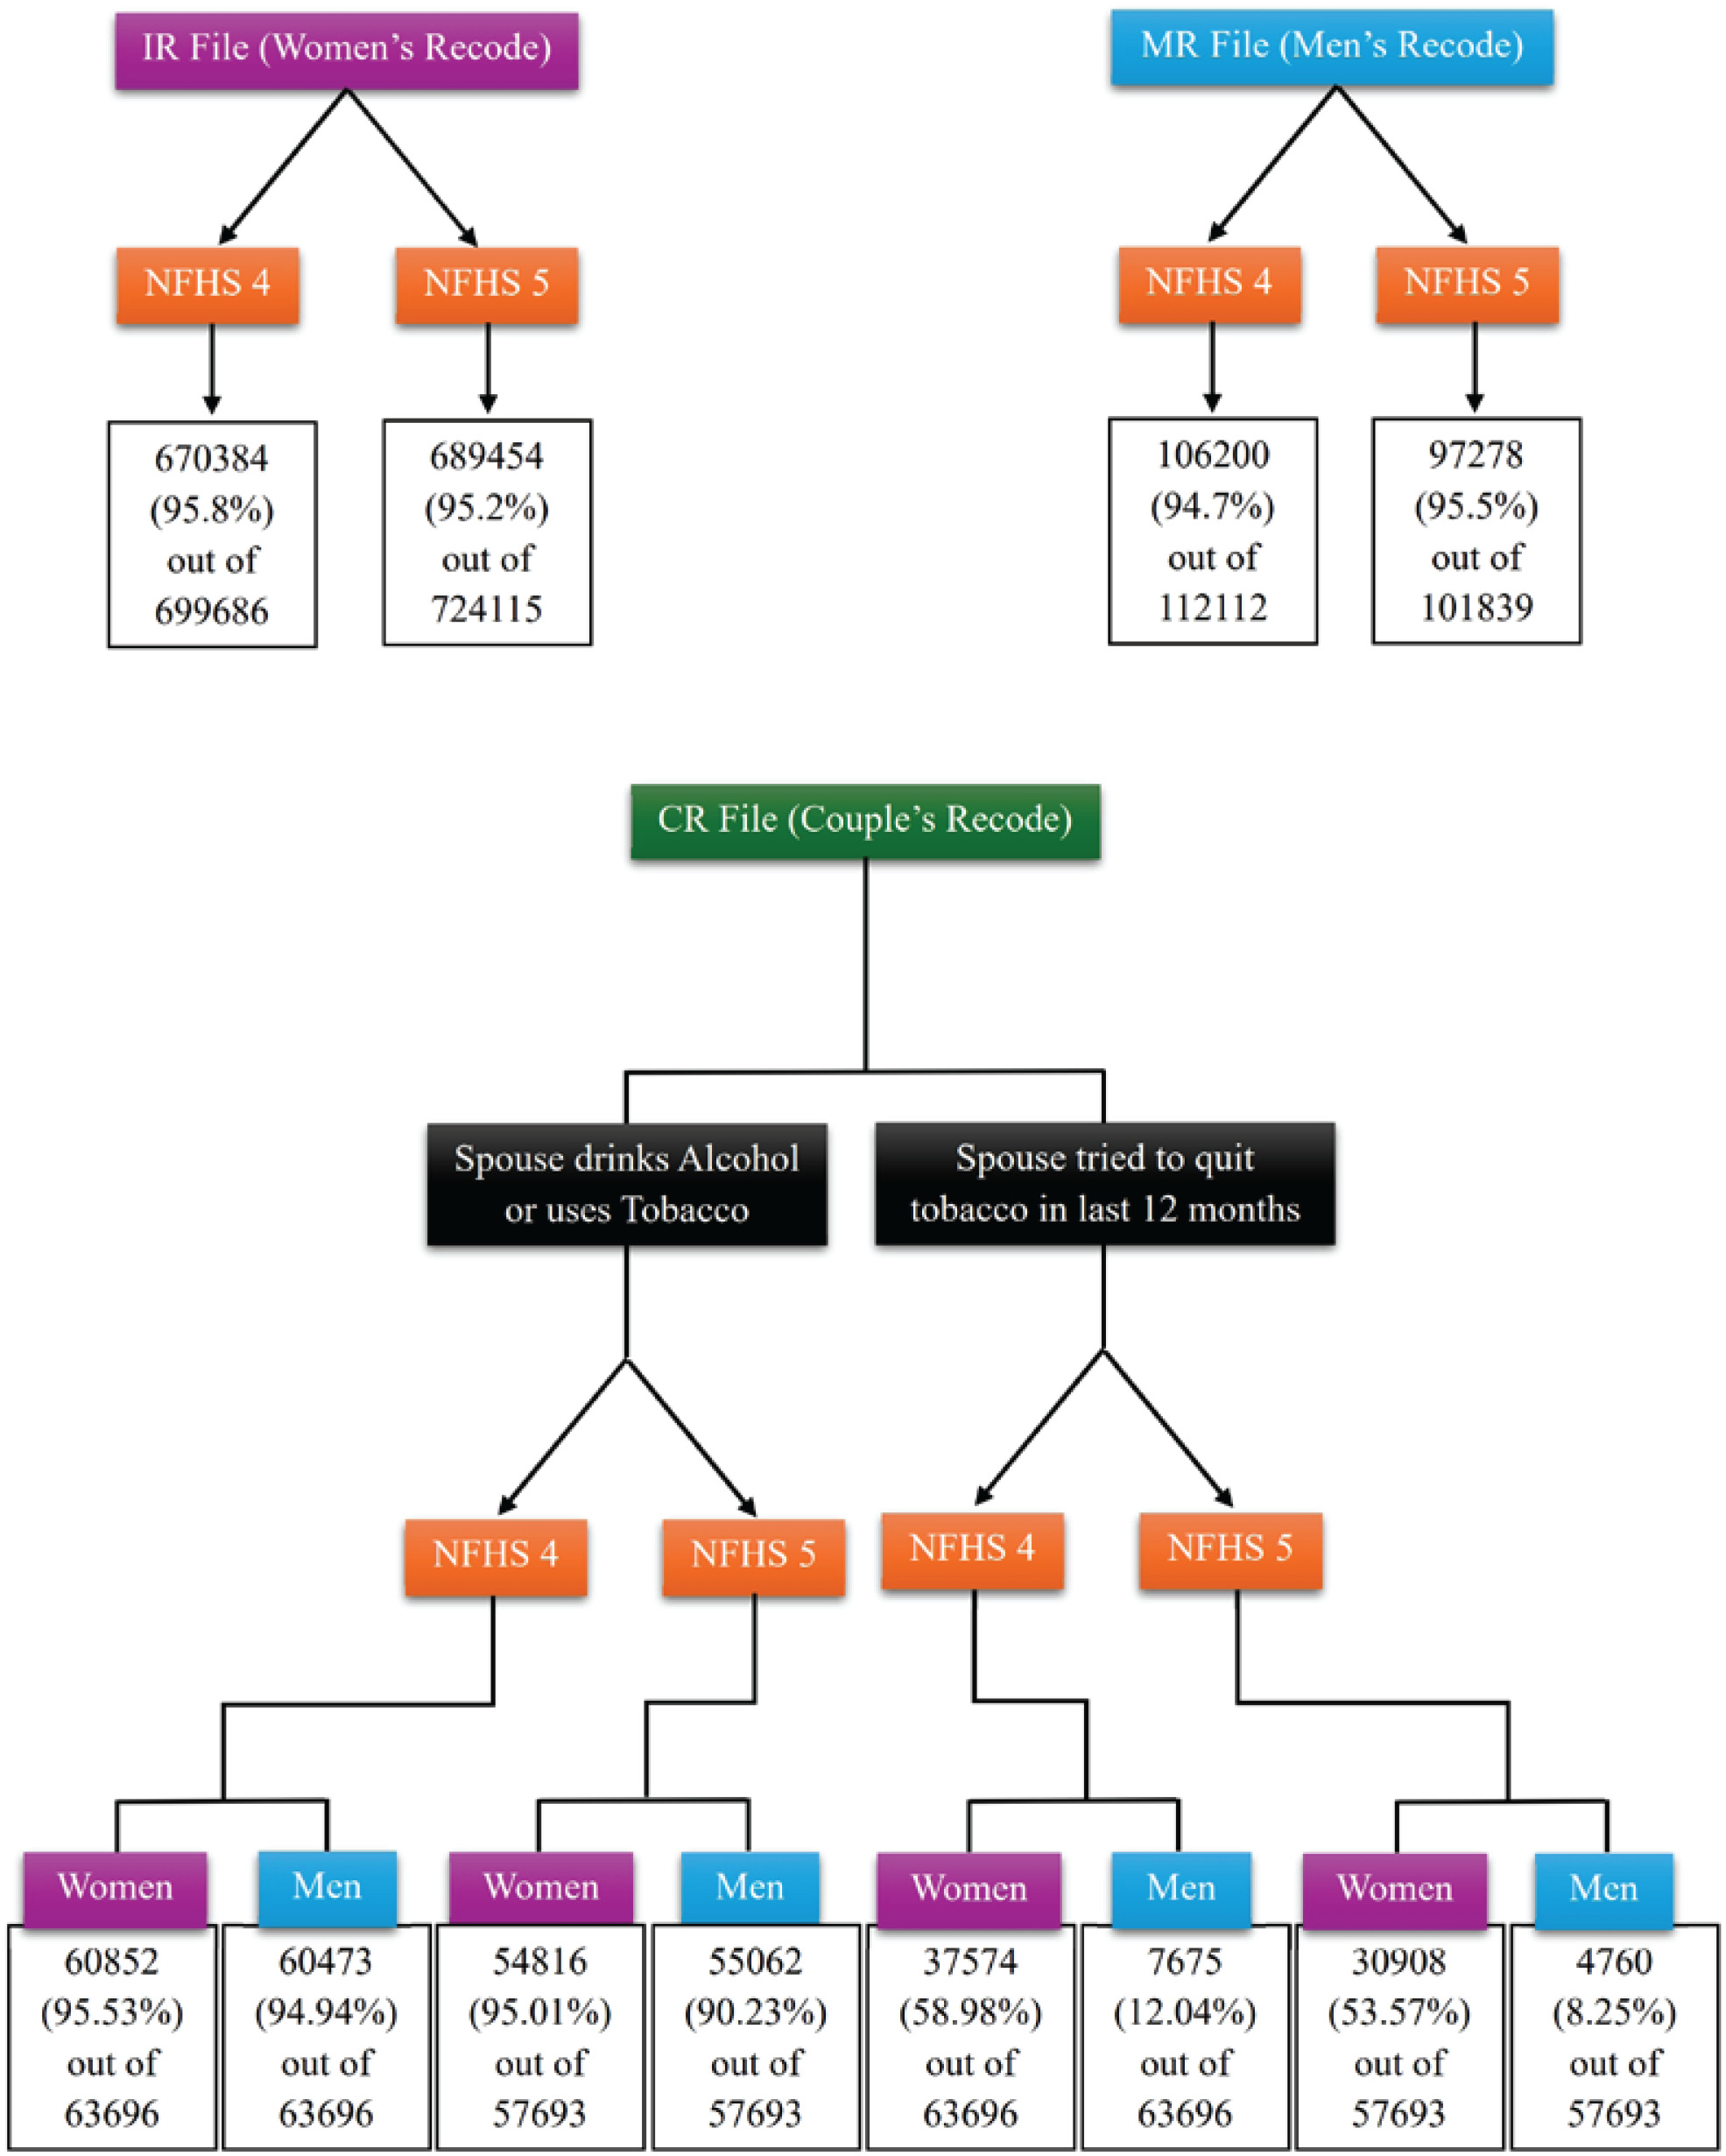
The details of the cases included in the analysis are given in Figure 1. Among the cases selected from the IR dataset and the MR dataset, 127133 (18.9%) women and 20026 (17.8%) men in NFHS-4 belonged to the Scheduled Tribes. In NFHS-5, 135239 (19.6%) women and 19354 (19.0%) men were from Scheduled Tribes. Further, among the CR Dataset of NFSH-4, 11767 (19.34%) out of 60852 women and 11755 (19.44%) out of 60473 men belonged to the Scheduled Tribes, respectively. Similarly, 11405 (20.81%) out of 54816 women and 11378 (20.66%) out of 55062 men belonged to Scheduled Tribes during NFHS-5. Moreover, data on the spouses who tried to quit tobacco use in the last 12 months were available for only 37574 (58.98%) men (spouse of women) and for only 7675 (12.04%) women (spouse of men) in the CR dataset from NFHS-4. Similarly, data for the men (spouses of women) who tried to quit tobacco use in the last 12 months were available for 30908 (53.57%) men, and for the women (spouses of men), they were available only for 4760 (8.25%) women.
Prevalence of tobacco usage
Sociodemographic characteristics of the study population
In NFHS-4, 1.73% of women and 1.54% of men were aged 15–19 years. Among tribal groups, 0.62% of women and 3.84% of men drank alcohol, while 3.99% of women and 2.17% of men had no education. Only 0.44% of women and 0.40% of men’s spouses were pregnant. The poorest wealth category included 3.91% of women and 3.58% of men; 8.19% of women and 8.02% of men were Hindu. Most people did not frequently use newspapers, magazines, or the radio, but 3.99% of women and 3.97% of men watched TV weekly. About 8.06% of women and 7.54% of men lived in rural areas, and 2.34% of women and 2.13% of men were from the East zone.
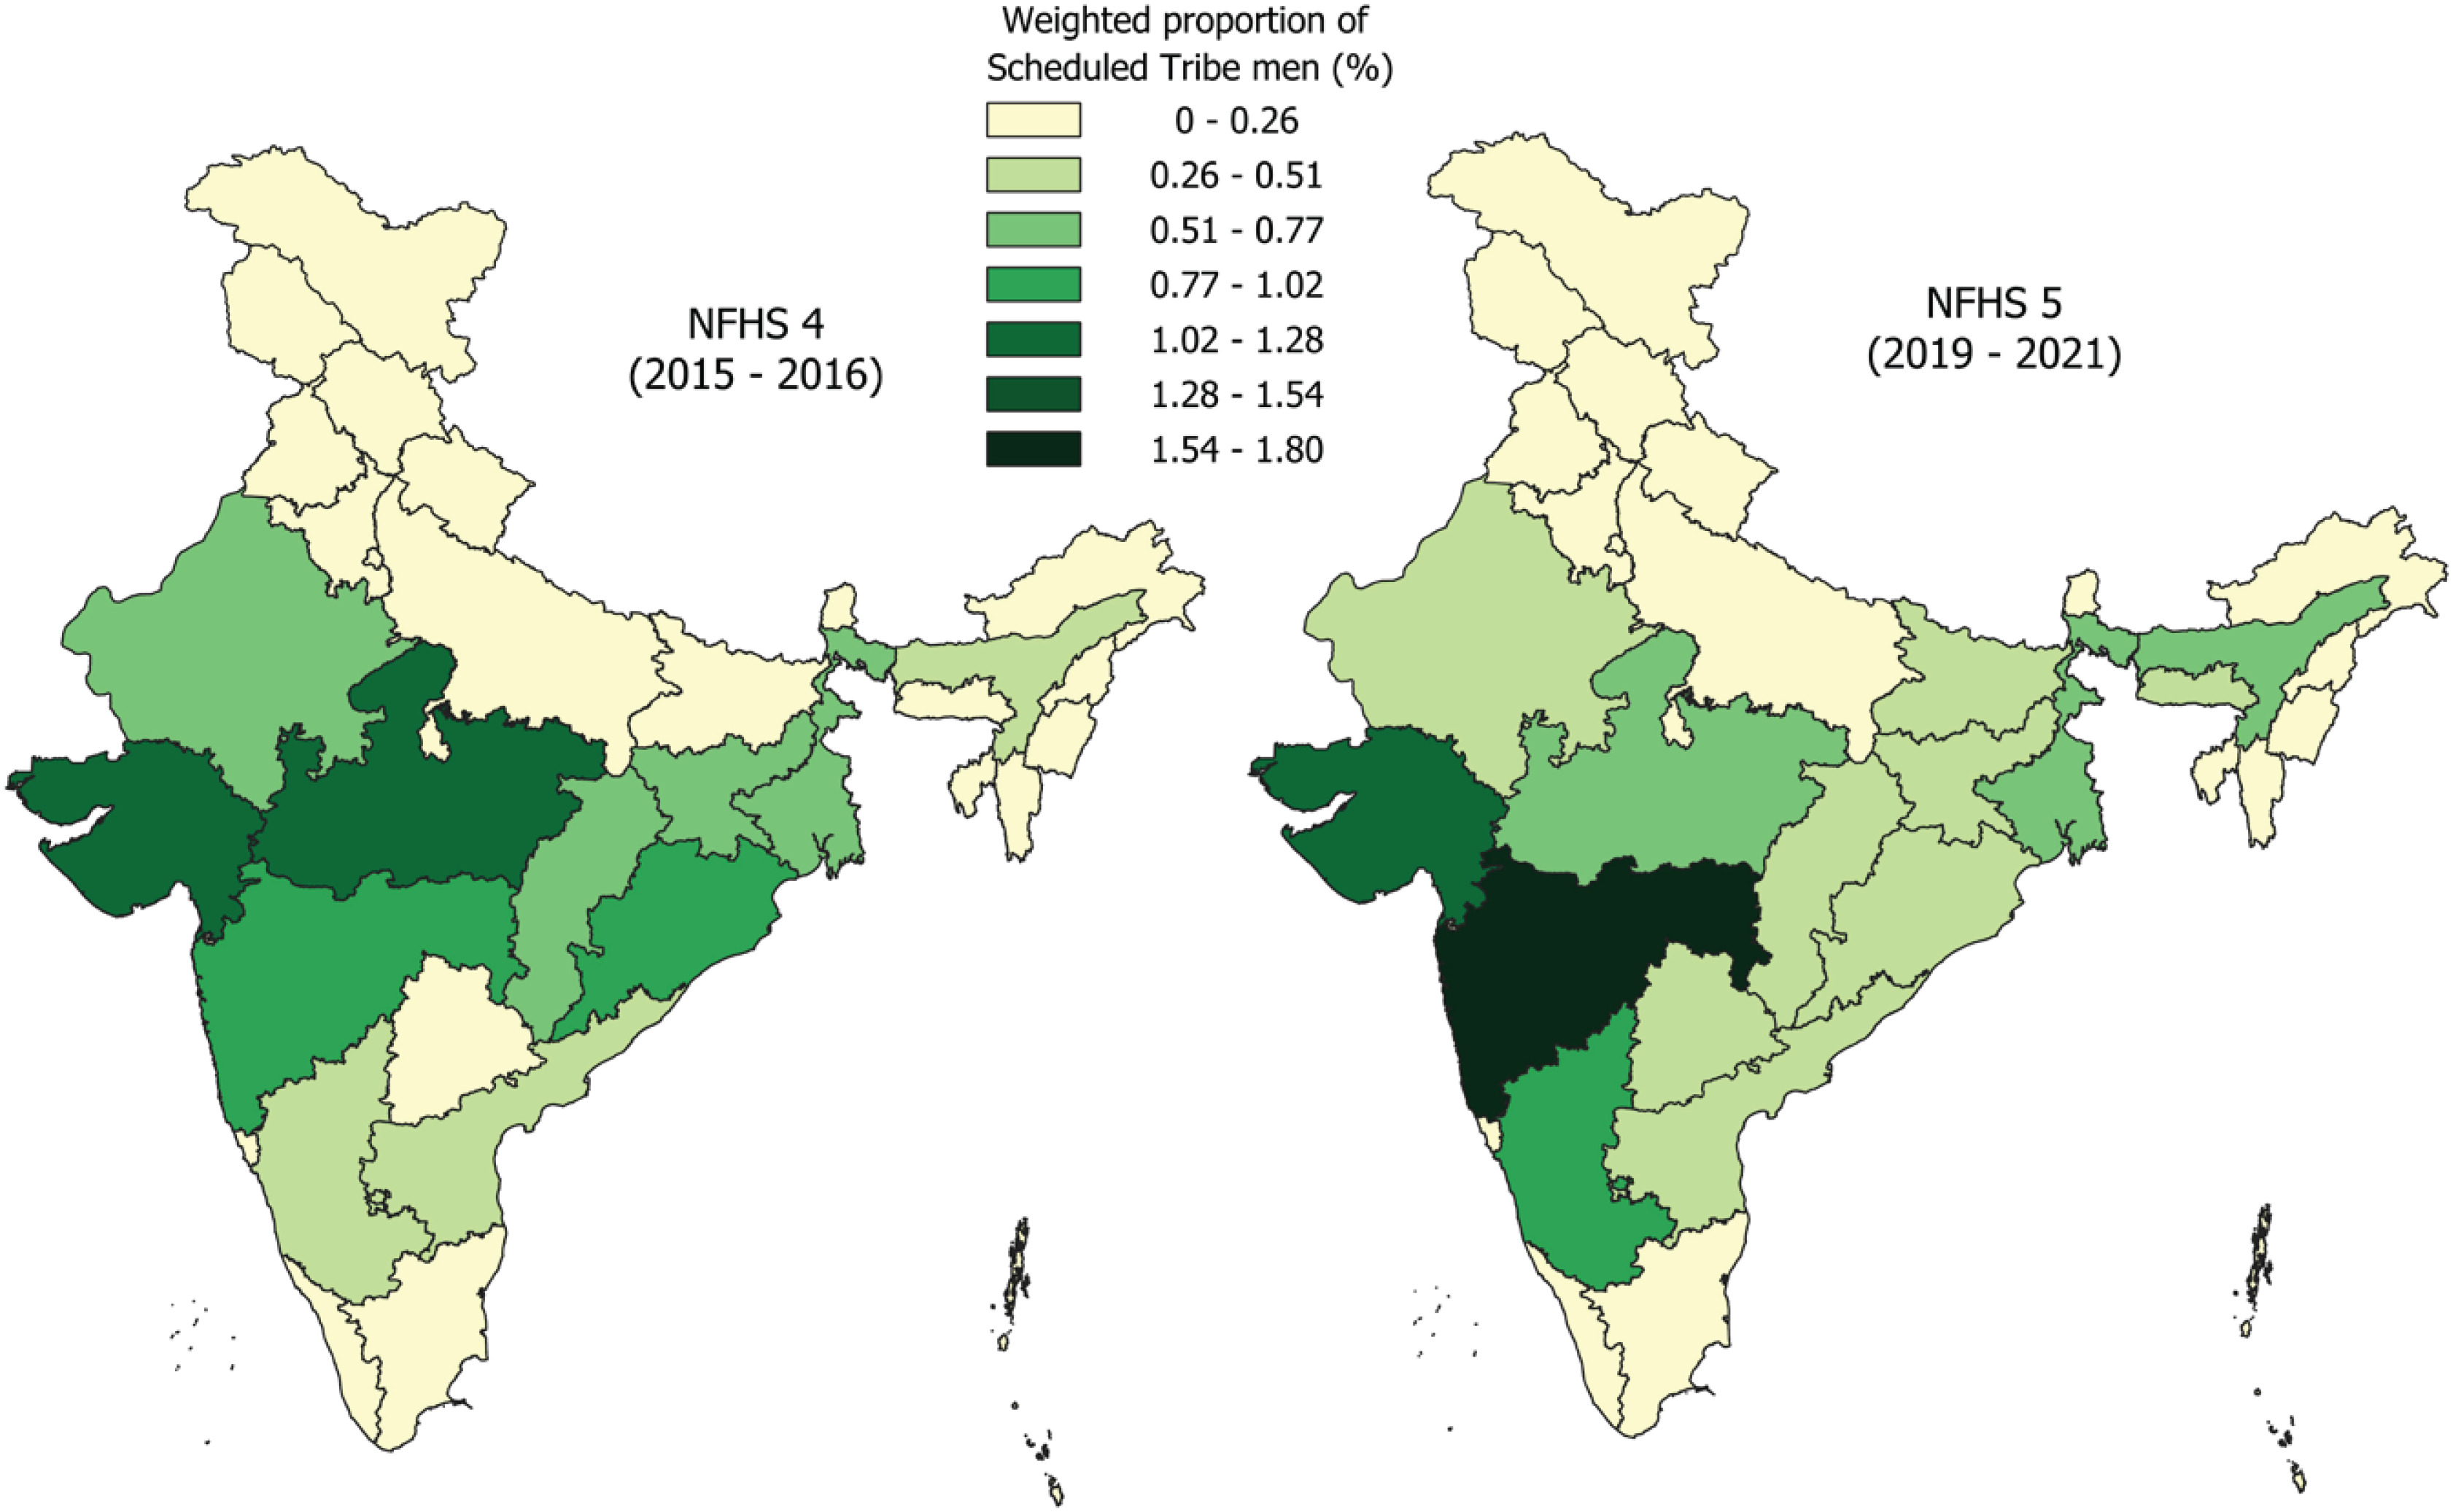
In NFHS-5, 1.70% of women and 1.59% of men were aged 15–19 years. The proportion of uneducated women and men was 3.36% and 1.85%, respectively. Alcohol consumption remained low (0.62% of women and 3.84% of men). Pregnancy rates were similar (0.39% of women and spouses of men). The poorest wealth category included 4.23% of women and 3.74% of men. Hinduism was followed by 8.38% of women and 8.17% of men. No one used mass media frequently. Around 8.35% of women and 8.05% of men lived in rural areas. The East zone had 2.38% of women and 3.09% of men. The state-wise distribution of tribal women and tribal men during NFHS-4 and NFHS-5 is given in Figure 2 and Figure 3, respectively. Further, distribution of tribal populations based on the type of tobacco usage among women and men during both surveys is given in Table 1. In addition, the unweighted distribution of the Tribal women and men is given in Supplementary file Table 1.
Table 1
Prevalence of specific tobacco products used among Scheduled Tribe women and men in India, National Family Health Survey NFHS-4 (2015–2016) and NFHS-5 (2019–2021)
[i] Unweighted and weighted percentages were calculated using all Scheduled Tribe women or men in the respective survey as the denominator. Respondents could report the use of more than one tobacco product; therefore, percentages for individual tobacco products are not mutually exclusive and do not sum to 100%. na: not available.
Figure 2
State-wise weighted proportion (%) of Scheduled Tribe women in India, National Family Health Survey NFHS-4 (2015–2016) and NFHS-5 (2019–2021)
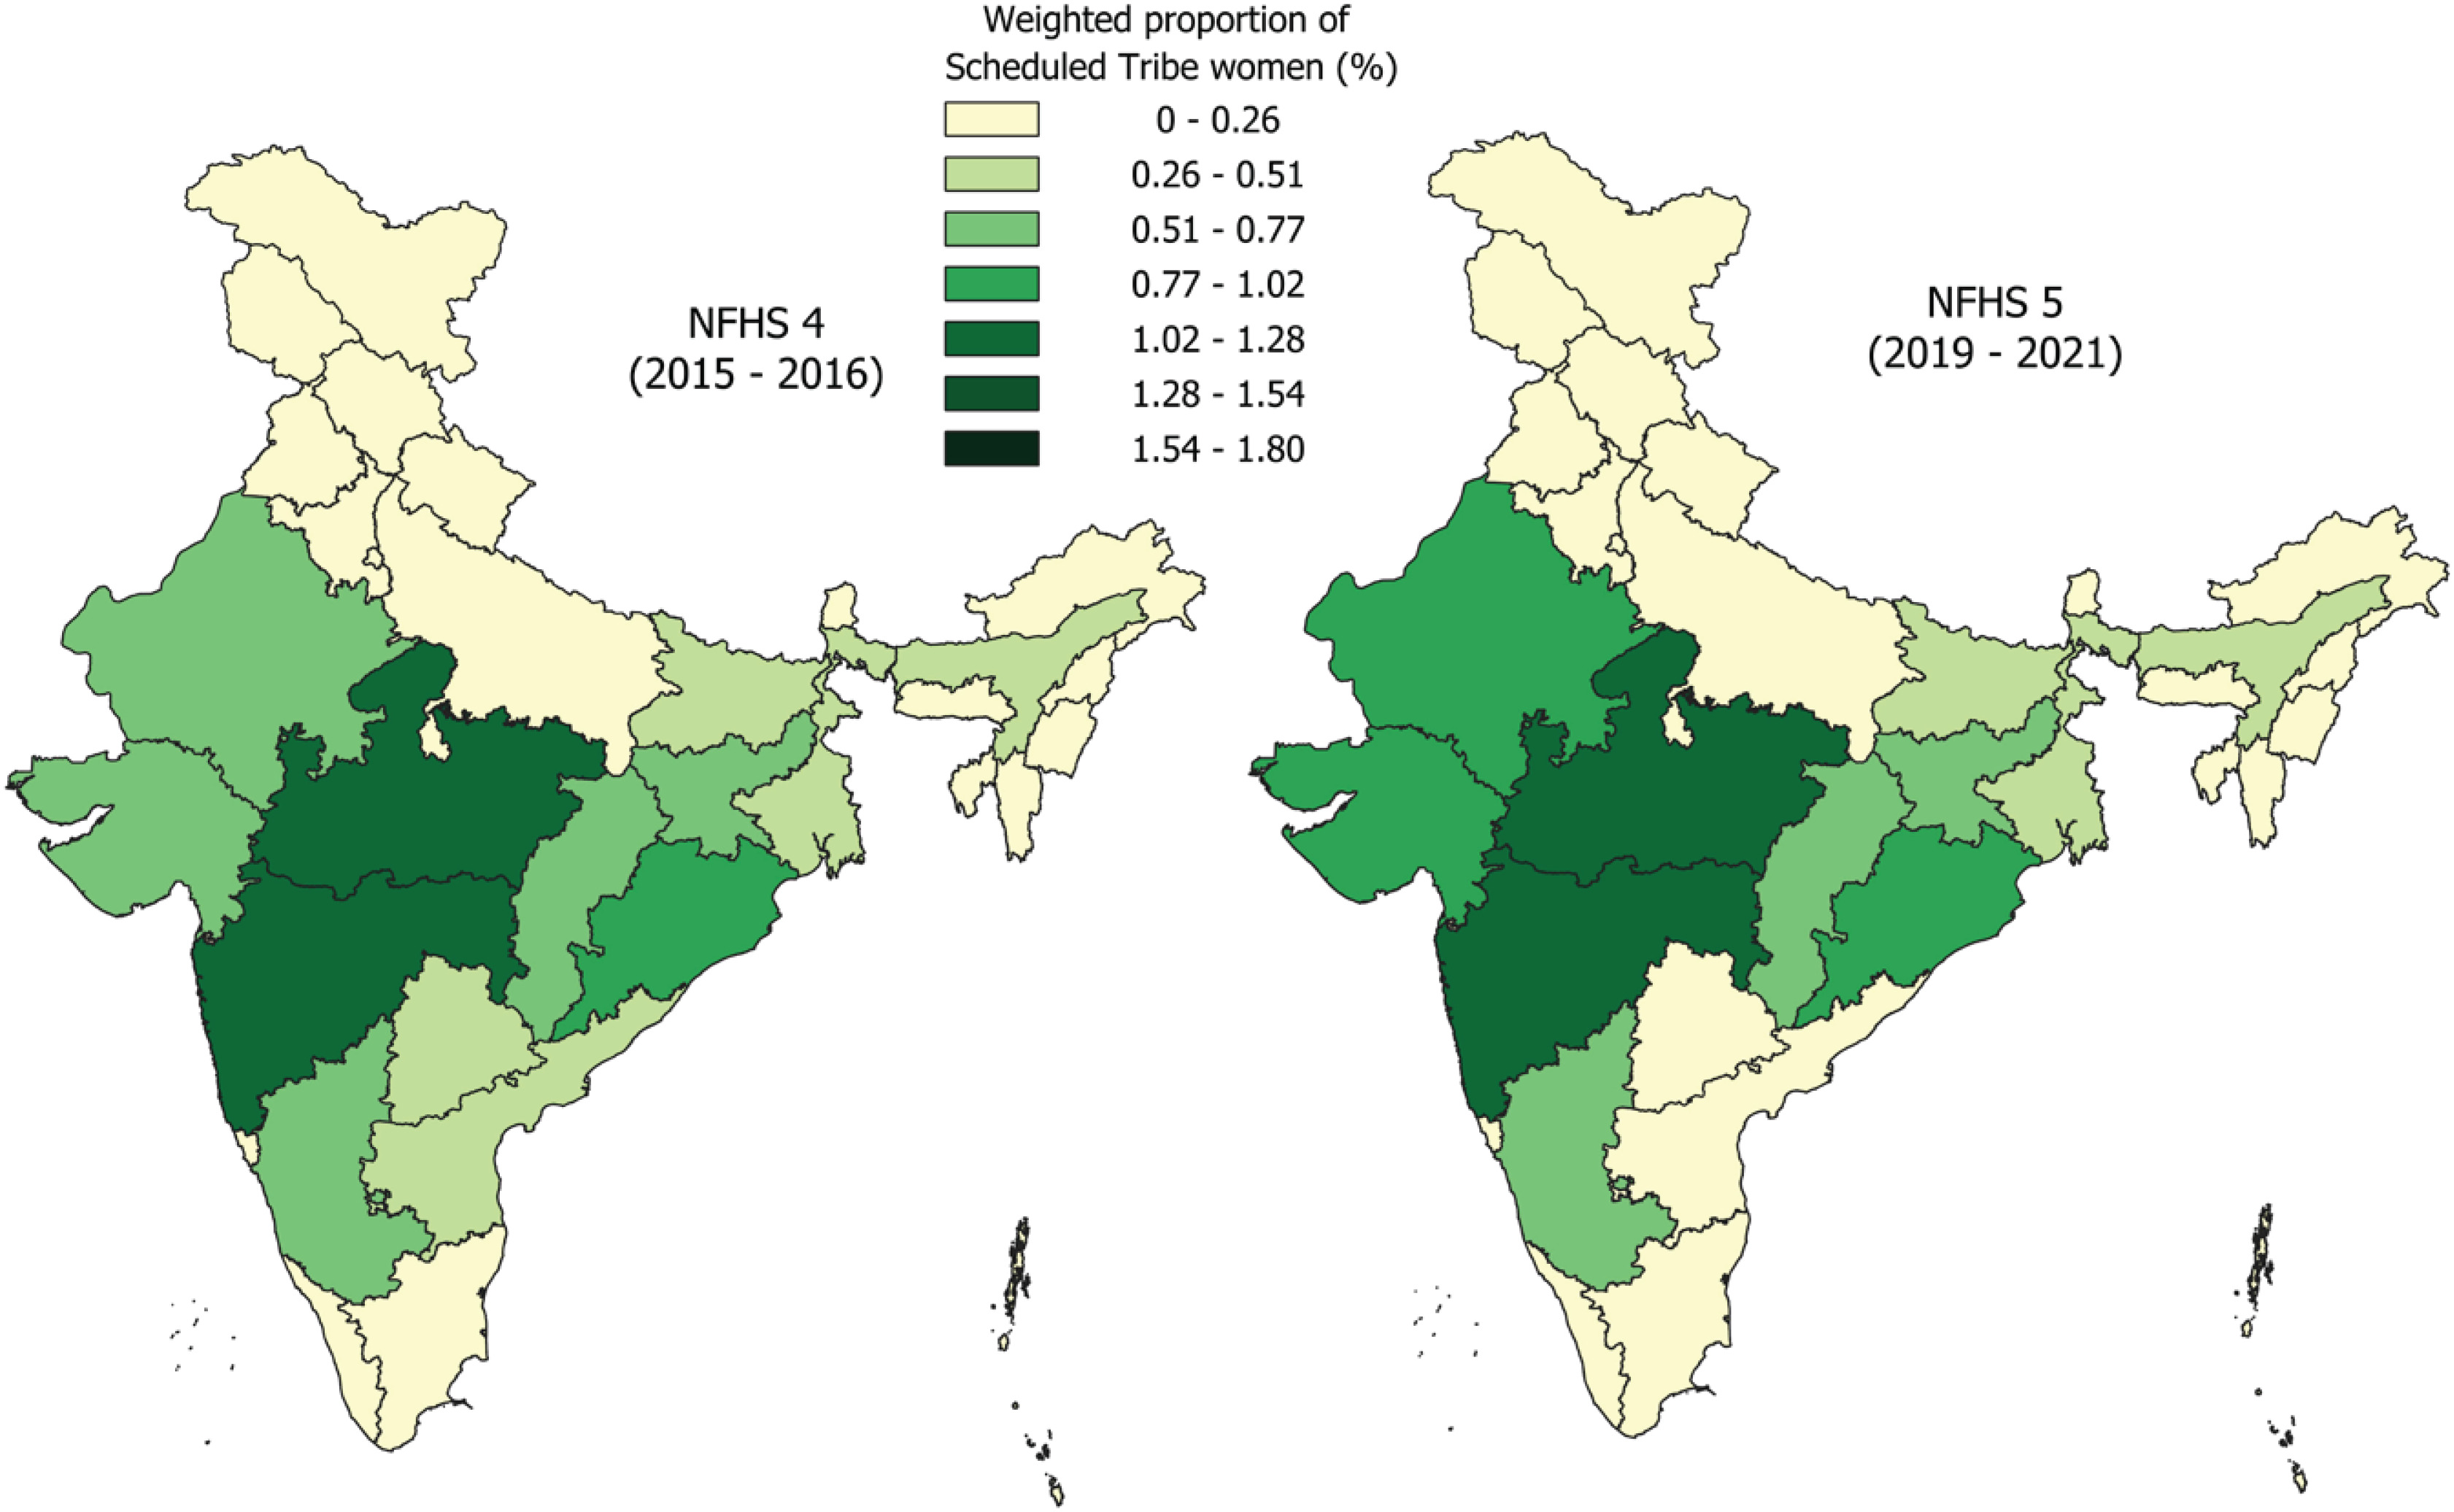
Figure 3
State-wise weighted proportion (%) of Scheduled Tribe men in India, National Family Health Survey NFHS-4 (2015–2016) and NFHS-5 (2019–2021)
According to the CR dataset, NFHS-4, among the couples, the spouses of 4.96% of tribal women, that is, men, were drinking alcohol, whereas the spouses of only 0.75% of tribal men were drinking alcohol. Similarly, spouses of 6.78% of tribal women and 1.97% of tribal men are users of tobacco. In the subgroup of couples, in the last 12 months, spouses of only 3.31% tribal women and spouses of 5.53% tribal men tried to quit tobacco use. However, during NFHS-5, the spouses of 4.56% tribal women and the spouses of 0.50% tribal men were drinking alcohol. Moreover, spouses of 6.76% tribal women and 1.44% tribal men were the users of tobacco. In the subgroup of couples, in the last 12 months, spouses of 3.49% tribal women and spouses of 6.98% tribal men tried to quit tobacco use. Further details on the descriptive characteristics of the study population are provided in Table 2.
Table 2
Weighted proportion of Scheduled Tribe women, men, and couples within sociodemographic categories in India, National Family Health Survey NFHS-4 (2015–2016) and NFHS-5 (2019–2021)
[i] Percentages represent the weighted proportion of Scheduled Tribe participants within each category of the corresponding survey population (e.g. all women aged 15–19 years). Consequently, percentages within each factor sum to the overall weighted proportion of Scheduled Tribe participants in the respective dataset rather than to 100%. na: not available. x: not applicable.
Type of tobacco usage among tribals
Among tribal women, paan with tobacco, khaini, and paan masala with tobacco were most common, while smoked products were less frequent. Among tribal men, paan masala with tobacco and khaini were most common, but cigarettes, cigars/cheroots, and hookah accounted for a substantially larger share than among women. Between NFHS-4 and NFHS-5, khaini fell among both genders, women: 4.71% to 3.61%; and men: 19.81% to 15.22%, while cigarette use among men rose from 12.52% to 14.93% as given in Table l.
Association of tobacco use with independent factors
The OR for tobacco use among tribal women, men, and couples, is shown in Supplementary file Table 2. Alcohol consumption was associated with higher odds of tobacco use among women in both surveys, with the OR decreasing from 5.95 (95% CI: 5.31–6.68) in NFHS-4 to 4.47 (95% CI: 3.91–5.10) in NFHS-5. Compared with higher wealth groups, the poorest wealth category had higher odds of tobacco use in both survey rounds. Among women, the magnitude of the association was greater in NFHS-5 than in NFHS-4. Rural residence was associated with around two to three times higher odds of tobacco use across both surveys. Similarly, lower formal education among men was associated with higher odds of tobacco use, with a decline in magnitude from NFHS-4 to NFHS-5. Differences in odds of tobacco use were observed across regions, with the Northeast showing markedly elevated odds. The magnitude of association among couples was lower in NFHS-5 relative to NFHS-4.
Compared with non-tribal tobacco users, tribal women in younger age groups had significantly higher adjusted odds of tobacco use in both NFHS-4 and NFHS-5. The highest odds were observed among those aged 15–19 years (AOR=2.31; 95% CI: 1.97–2.70 in NFHS-4 and AOR= 2.28; 95% CI: 1.85–2.81 in NFHS-5), relative to women aged 45–50 years. Similarly, for men, the highest adjusted odds of tobacco use were observed among those aged 15–19 years in NFHS-4 (AOR=1.55; 95% CI: 1.32–1.81) and AOR=1.69 (95% CI: 1.35–2.13) in NFHS-5. Secondary education was associated with lower odds among women: AOR=0.67 (95% CI: 0.55–0.82) in NFHS-4 and AOR=0.57 (95% CI: 0.43–0.75) in NFHS-5. For men, secondary education was protective only in NFHS-4 (AOR=0.72; 95% CI: 0.60–0.87). Compared with non-tribal tobacco users, alcohol consumption was associated with higher odds of tobacco use for both tribal women and men. Among women, the AOR changed from 5.24 (95% CI: 4.67–5.88) in NFHS-4 to 3.80 (95% CI: 3.31–4.37) in NFHS-5. In contrast, the odds among men were similar across both survey rounds (AOR=1.83 in NFHS-4 and AOR=1.87 in NFHS-5). No significant association was observed between pregnancy status and tobacco use among women and their spouses. The poorest wealth category was associated with the highest adjusted odds of tobacco use among both tribal women and men compared with non-tribal tobacco users. Among women, the odds increased markedly from AOR=2.77 (95% CI: 2.10–3.65) in NFHS-4 to AOR=5.35 (95% CI: 3.94–7.26) in NFHS-5. In contrast, the odds among men were substantially higher overall but showed a slight decrease between survey rounds (AOR=9.51; 95% CI: 7.20–12.57 in NFHS-4 and AOR=7.21; 95% CI: 5.02–10.35 in NFHS-5). For women following non-Hindu religions, AOR of tobacco use changed from 0.87 (95% CI: 0.78–0.97) in NFHS-4 to 1.40 (95% CI: 1.25–1.56) in NFHS-5, compared with non-tribal tobacco users. Among men, this association was protective in NFHS-4 (AOR=0.82; 95% CI: 0.71–0.95) but was not statistically significant in NFHS-5. Compared with non-tribal tobacco users, tribal women and men showed varying odds of being a tobacco user based on the frequency of exposure to mass media like reading newspapers, listening to the radio, or watching television. Further, living in rural areas was associated with higher odds of tobacco use compared with non-tribal tobacco users. Among women, AOR was 1.46 (95% CI: 1.21–1.78) in NFHS-4 and 1.57 (95% CI: 1.28–1.93) in NFHS-5. Similarly, among men, AOR was 1.44 (95% CI: 1.14–1.81) in NFHS-4 and 1.72 (95% CI: 1.35–2.20) in NFHS-5. Women in the West zone had the higher adjusted odds of tobacco use compared with non-tribal tobacco users, with AOR=2.04 (95% CI: 1.43–2.91) in NFHS-4 and AOR=2.59 (95% CI: 2.04–3.28) in NFHS-5. However, among men, the highest odds were observed in the Northeast zone during NFHS-4 (AOR=5.54; 95% CI: 4.17–7.35), which declined significantly in NFHS-5 (AOR=3.28; 95% CI: 2.48–4.34). In the CR datasets, AOR for the poorest tribal men was 9.81 (95% CI: 6.90–13.96) in NFHS-4, and the Western zone had the highest adjusted odds among men in both survey rounds. Detailed adjusted odds ratios are presented in Table 3.
Table 3
Adjusted odds ratios (AORs) and 95% confidence intervals (CIs) for tobacco use among Scheduled Tribe women, men, and couples compared with nontribal tobacco users in India, National Family Health Survey NFHS-4 (2015–2016) and NFHS-5 (2019–2021)
| Variables | Categories | Women | Men Women | Couples | |||||
|---|---|---|---|---|---|---|---|---|---|
| Men | |||||||||
| NFHS-4 (N=670384) | NFHS-5 (N=689454) | NFHS-4 (N=106200) | NFHS-5 (N=97279) | NFHS-4 (N=60852) | NFHS-5 (N=54816) | NFHS-4 (N=60473) | NFHS-5 (N=55062) | ||
| Age (years) | 15–19 | 2.31 (1.97–2.70)** | 2.28 (1.85–2.81)** | 1.55 (1.32–1.81)** | 1.69 (1.35–2.13)** | 2.17 (1.18–4.01)* | 3.40 (1.36–8.45)** | 2.48 (1.48–4.18)** | 2.04 (0.73–5.72) |
| 20–24 | 2.12 (1.86–2.42)** | 1.90 (1.63–2.22)** | 1.23 (1.07–1.42)* | 1.50 (1.23–1.83)** | 1.97 (1.41–2.74)** | 1.65 (1.07–2.55)* | 1.65 (1.37–2.00)** | 1.78 (1.33–2.39)** | |
| 25–29 | 1.60 (1.44–1.79)** | 1.80 (1.60–2.02)** | 1.59 (1.01–1.32)* | 1.45 (1.21–1.74)** | 1.75 (1.31–2.33)** | 1.89 (1.29–2.77)** | 1.43 (1.22–1.68)** | 1.55 (1.28–1.87)** | |
| 30–34 | 1.35 (1.23–1.49)** | 1.39 (1.24–1.56)** | 1.05 (0.92–1.21) | 1.15 (0.97–1.35) | 1.15 (0.87–1.53) | 1.33 (0.95–1.85) | 1.14 (0.99–1.32) | 1.20 (1.00–1.43)* | |
| 35–39 | 1.14 (1.03–1.27)* | 1.25 (1.12–1.39)** | 1.00 (0.87–1.16) | 1.15 (0.98–1.35) | 1.11 (0.84–1.48) | 1.32 (0.96–1.82) | 1.07 (0.93–1.24) | 1.20 (1.02–1.42)* | |
| 40–44 | 0.99 (0.90–1.09) | 1.10 (0.99–1.22) | 1.00 (0.88–1.15) | 1.04 (0.88–1.24) | 0.93 (0.69–1.24) | 1.09 (0.80–1.49) | 1.03 (0.90–1.19) | 0.99 (0.83–1.19) | |
| 45–50 (ref.) | 1 | 1 | 1 | 1 | 1 | 1 | 1 | 1 | |
| 50–54 | na | na | 1.02 (0.87–1.19) | 0.94 (0.77–1.14) | na | na | 0.91 (0.76–1.08) | 0.90 (0.73–1.12)* | |
| Education level | No education | 0.81(0.64–1.02) | 0.73 (0.54–0.97)* | 0.96 (0.77–1.21) | 1.00 (0.77–1.29) | 0.84 (0.44–1.58) | 0.57 (0.27–1.18) | 0.79 (0.60–1.03) | 0.74 (0.54–0.99)** |
| Primary education | 0.67 (0.53–0.84)** | 0.55 (0.42–0.73)** | 0.79 (0.64–0.98)* | 0.82 (0.64–1.04)* | 0.72 (0.39–1.33) | 0.43 (0.21–0.91)* | 0.66 (0.50–0.86)** | 0.65 (0.48–0.87) | |
| Secondary education | 0.67 (0.55–0.82)** | 0.57 (0.43–0.75)** | 0.72 (0.60–0.87)* | 0.95 (0.77–1.15) | 0.62 (0.35–1.09) | 0.46 (0.24–0.90)* | 0.63 (0.50–0.80)** | 0.77 (0.60–1.00) | |
| Higher education (ref.) | 1 | 1 | 1 | 1 | 1 | 1 | 1 | 1 | |
| Drink alcohol | Yes | 5.24 (4.67–5.88)** | 3.80 (3.31–4.37)** | 1.83 (1.67–2.01)** | 1.87 (1.64–2.14)** | 5.84 (4.28–7.95)** | 3.25 (2.25–4.70)** | 1.74 (1.57–1.93)** | 1.77 (1.53–2.05)** |
| No (ref.) | 1 | 1 | 1 | 1 | 1 | 1 | 1 | 1 | |
| Currently pregnant/Spouse pregnant | Yes (ref.) | 1 | 1 | 1 | 1 | 1 | 1 | 1 | 1 |
| No | 1.05 (0.91–1.22) | 1.00 (0.84–1.20) | 0.97 (0.82–1.15) | 0.95 (0.76–1.19) | 1.07 (0.73–1.55) | 0.99 (0.60–1.64) | 1.02 (0.85–1.21) | 0.94 (0.75–1.18) | |
| Wealth index | Poorest | 2.77 (2.10–3.65)** | 5.35 (3.94–7.26)** | 9.51 (7.20–12.57)** | 7.21 (5.02–10.35)** | 4.93 (2.78–8.73)** | 4.91 (1.75–13.76)** | 9.81 (6.90–13.96)** | 7.91 (5.27–11.88)** |
| Poorer | 1.39 (1.07–1.80)* | 2.41 (1.77–3.28)** | 4.03 (3.09–5.27)** | 3.50 (2.46–4.98)** | 2.09 (1.21–3.60)** | 2.46 (0.87–6.93) | 4.42 (3.14–6.22)** | 3.81 (2.56–5.68)** | |
| Middle | 0.93 (0.72–1.21) | 1.73 (1.29–2.31)** | 2.40 (1.81–3.17)** | 2.14 (1.50–3.05)** | 1.39 (0.85–2.26) | 1.80 (0.66–4.89) | 2.63 (1.88–3.68)** | 2.22 (1.51–3.27)** | |
| Richer | 1.00 (0.74–1.35) | 1.30 (0.98–1.72) | 1.59 (1.23–2.05)** | 1.25 (0.89–1.75) | 1.76 (0.90–3.43) | 0.92 (0.35–2.43) | 1.77 (1.28–2.45)** | 1.43 (0.96–2.13) | |
| Richest (ref.) | 1 | 1 | 1 | 1 | 1 | 1 | 1 | 1 | |
| Religion | Hindu (ref.) | 1 | 1 | 1 | 1 | 1 | 1 | 1 | 1 |
| Non-Hindu | 0.87 (0.78–0.97)** | 1.40 (1.25–1.56)** | 0.82 (0.71–0.95)** | 0.97 (0.82–1.16) | 1.05 (0.82–1.35) | 1.62 (1.23–2.13)** | 0.77 (0.66–0.91)** | 0.92 (0.76–1.12) | |
| Frequency of reading newspapers per week | 0 | 0.90 (0.78–1.04) | 0.85 (0.75–0.96)** | 1.05 (0.92–1.19) | 1.20 (1.04–1.39)* | 0.72 (0.52–1.01) | 1.27 (0.86–1.87) | 1.04 (0.88–1.22) | 1.31 (1.11–1.55)** |
| <1 (ref.) | 1 | 1 | 1 | 1 | 1 | 1 | 1 | 1 | |
| ≥1 | 1.42 (1.22–1.65)** | 1.73 (1.42–2.12)** | 0.95 (0.83–1.09) | 0.98 (0.83–1.16) | 0.88 (0.57–1.35) | 1.97 (1.08–3.57)* | 0.94 (0.79–1.11) | 1.07 (0.87–1.32) | |
| Almost every day | 1.62 (1.33–1.97)** | na | 0.81 (0.70–0.94) | na | 1.29 (0.74–2.25) | na | 0.77 (0.64–0.93)** | na | |
| Frequency of listening to radio per week | 0 | 0.71 (0.49–1.04) | 1.06 (0.93–1.21) | 1.08 (0.94–1.26) | 0.98 (0.84–1.16) | 0.91 (0.60–1.36) | 1.04 (0.72–1.50) | 1.07 (0.91–1.27) | 0.97 (0.80–1.18) |
| <1 (ref.) | 1 | 1 | 1 | 1 | 1 | 1 | 1 | 1 | |
| ≥1 | 0.58 (0.39–0.84)** | 0.86 (0.65–1.14) | 0.99 (0.83–1.18) | 1.18 (0.92–1.51) | 0.60 (0.35–1.03) | 0.98 (0.44–2.18) | 1.03 (0.85–1.26) | 1.08 (0.82–1.43) | |
| Almost every day | 0.62 (0.40–0.95)* | na | 1.02 (0.81–1.29) | na | 0.79 (0.40–1.57) | na | 1.10 (0.82–1.46) | na | |
| Frequency of watching television per week | 0 | 0.92 (0.81–1.04) | 1.05 (0.95–1.16) | 0.99 (0.86–1.14) | 0.98 (0.84–1.16) | 0.71 (0.53–0.96) | 1.29 (0.97–1.70) | 1.02 (0.88–1.17) | 0.95 (0.81–1.11) |
| <1 (ref.) | 1 | 1 | 1 | 1 | 1 | 1 | 1 | 1 | |
| ≥1 | 1.30 (1.16–1.47)** | 1.03 (0.93–1.13) | 1.22 (1.07–1.39)* | 0.86 (0.75–0.99)* | 1.10 (0.81–1.51) | 1.11 (0.84–1.46) | 1.19 (1.02–1.38)* | 0.84 (0.71–0.98)* | |
| Almost every day | 0.95 (0.83–1.08) | na | 1.19 (1.02–1.37)* | na | 0.79 (0.56–1.09) | na | 1.18 (1.01–1.39)* | na | |
| Residence | Urban (ref.) | 1 | 1 | 1 | 1 | 1 | 1 | 1 | 1 |
| Rural | 1.46 (1.21–1.78)** | 1.57 (1.28–1.93)** | 1.44 (1.14–1.81)** | 1.72 (1.35–2.20)** | 1.22 (0.79–1.89) | 1.79 (1.19–2.68)** | 1.38 (1.06–1.80)* | 1.76 (1.37–2.26)** | |
| Zone | North | 0.97 (0.68–1.38) | 0.94 (0.71–1.23) | 1.79 (1.33–2.41)** | 1.25 (0.91–1.71) | 1.11 (0.58–2.11) | 0.83 (0.33–2.07) | 1.90 (1.41–2.57)** | 1.33 (0.94–1.86) |
| Northeast | 1.97 (1.44–2.70)** | 1.75 (1.42–2.17)** | 5.54 (4.17–7.35)** | 3.28 (2.48–4.34)** | 1.49 (0.83–2.69) | 1.15 (0.50–2.61) | 3.88 (2.89–5.22)** | 2.17 (1.60–2.96)** | |
| Central | 0.99 (0.72–1.35) | 1.03 (0.84–1.28) | 1.19 (0.90–1.56) | 0.71 (0.53–0.94)** | 1.09 (0.62–1.91) | 0.83 (0.36–1.88) | 1.08 (0.82–1.42) | 0.63 (0.46–0.85)** | |
| East | 1.16 (0.84–1.60) | 1.00 (0.80–1.25) | 1.29 (0.95–1.74) | 0.56 (0.40–0.78)** | 1.32 (0.72–2.42) | 0.89 (0.38–2.07) | 1.24 (0.91–1.67) | 0.51 (0.36–0.72)** | |
| West | 2.04 (1.43–2.91)** | 2.59 (2.04–3.28)** | 3.04 (2.26–4.10)** | 2.31 (1.71–3.13)** | 2.85 (1.50–5.41) | 2.67 (1.16–6.14)* | 3.12 (2.30–4.25)** | 1.96 (1.43–2.69)** | |
| South (ref.) | 1 | 1 | 1 | 1 | 1 | 1 | 1 | 1 | |
| Spouse drinks alcohol | Yes | x | x | x | x | 2.25 (1.85–2.73)** | 1.89 (1.50–2.39)* | 5.74 (4.51–7.31)** | 2.77 (1.99–3.84)** |
| No (ref.) | x | x | x | x | 1 | 1 | 1 | 1 | |
| Spouse uses tobacco | Yes | x | x | x | x | 0.91 (0.67–1.24) | 1.08 (0.82–1.42) | 1.85 (1.63–2.11)** | 2.00 (1.66–2.41)** |
| No (ref.) | x | x | x | x | 1 | 1 | 1 | 1 | |
| VIF, mean (range) | 2.30 (1.04–4.44) | 1.96 (1.04–3.38) | 2.09(1.03–2.92) | 1.83 (1.03–2.19) | 2.29 (1.08–5.45) | 1.97 (1.07–4.1) | 2.00 (1.03–3.43) | 1.74 (1.02–3.19) | |
Spousal correlates
The association of spousal behaviors with tobacco use differed for tribal women and men. Among women, having a spouse who consumed alcohol was associated with higher AOR of tobacco use, though this association decreased over time, from 2.25 (95% CI: 1.85–2.73) in NFHS-4 to 1.89 (95% CI: 1.50–2.39) in NFHS-5. Among men, the corresponding AORs were higher overall but also declined significantly between survey rounds, from 5.74 (95% CI: 4.51–7.31) in NFHS-4 to 2.77 (95% CI: 1.99–3.84) in NFHS-5. Spousal tobacco use was not significantly associated with tobacco use among women in either survey round. In contrast, men whose spouses used tobacco had higher AORs of tobacco use, increasing from 1.85 (95% CI: 1.63–2.11) in NFHS-4 to 2.00 (95% CI: 1.66–2.41) in NFHS-5.
Attempts by the spouse to quit tobacco in the past 12 months were not significantly associated with women’s tobacco use in either survey. For men, this factor was consistently associated with lower odds of tobacco use, with OR of 0.65 (95% CI: 0.49–0.73) in NFHS-4 and 0.65 (95% CI: 0.49–0.87) in NFHS-5. Mean variance inflation factors across all eight models ranged from 1.74 to 2.30, indicating no material multicollinearity.
DISCUSSION
Based on two nationally representative surveys, this analysis shows that tobacco use among Indian tribal populations is not a diffuse behavior by individuals. It is structurally patterned exposure, concentrated among the poorest with rural residence in Western and Northeastern zones, and consistently aggregating with the use of alcohol. The gradients are exceptionally steep, particularly among tribal men, where the AOR of tobacco use among the poorest exceeded by seven to tenfold across both surveys, relative to the richest. Not only did it persist, but it also widened between the two surveys despite modest improvements in education. Gender specific patterns add another dimension. Tobacco use by the tribal women, although low in prevalence, is more tightly linked to alcohol co-use and NFHS-5, and belonging to non-Hindu religious affiliation, while among tribal men, behavior shows a stronger spousal concordance and measurable shift towards smoked products. Together, these findings indicate that the tobacco usage among tribals is deeply embedded within structures of economic disadvantage.
Tobacco appears to function simultaneously as a socially normalized behavior, a low-cost stress-associated coping mechanism, and a commercially accessible addictive product in settings where preventive care and regulatory enforcement remain limited20,24. Secondary education was modestly protective, especially among women; however, with widening of wealth and rural gradients, it is evident that, schooling alone cannot offset deeper structural exposure. The geographical distribution of tobacco users among tribal populations was highly non-random. These patterns track the regional tobacco ecologies, with smokeless products dominating in Central and Western tribal belts, and smoked products more common in the Northeast. It may more likely reflect the combined influence of historical commercial penetration, uneven public health reach, and zonal variations in implementation of tobacco control rather than cultural attributes per se14,25.
The clustering of addictive behaviors within the same individuals and households, points to shared environmental drivers and probable common pathways of stress, deprivation, and social normalization. Therefore, tobacco control initiatives that ignore alcohol are therefore more likely to underperform among the tribal populations. Although, tobacco prevalence is lower among tribal women than men, women with stronger alcohol tobacco coupling, in association with steeper socioeconomic gradient, suggest a hidden and structurally driven exposure. The asymmetric spousal concordance, reflects gendered acceptability of smoking, household behavior ecology and male led purchasing patterns that shape the supply of tobacco among tribal households24. Though data are available for limited number of respondents, it is seen that a spouse who consumed alcohol was associated with elevated odds of tobacco use in both sexes, but the effect was substantially larger for men than for women and attenuated markedly between survey rounds, particularly among men, where the magnitude more than halved. Spousal tobacco use, in contrast, was an important correlate only among men, and modestly strengthened over time. The asymmetry is informative: tribal men’s tobacco use appears tightly coupled to the behavioral environment created by their wives, whereas tribal women’s tobacco use is shaped less by what their husbands do and more by their own alcohol use and structural position. This pattern is consistent with broader evidence that marital and household contexts exert a greater regulatory influence on men’s substance use than on women’s, and suggests that for tribal men, household-level interventions may carry more leverage than individual-targeted cessation alone26,27.
Between NFHS-4 and NFHS-5, the prevalence of khaini and paan with tobacco declined among both genders, while paan masala with tobacco and cigars/cheroots increased among men, suggesting a partial shift toward more commercialized and smoked products. Structural gradients, however, did not narrow, wealth and rural disparities widened in several models indicating that aggregate declines may mask a deepening concentration of risk in the most disadvantaged tribal subgroups. These patterns are broadly consistent with prior Indian evidence. Analyses of the Global Adult Tobacco Survey (GATS)-2 and the Longitudinal Aging Study in India (LASI) have identified low wealth, rural residence, and alcohol use as core determinants of tobacco use, including smokeless tobacco, among tribal communities14,20. Studies of specific tribal groups in Kerala, Maharashtra, and West Bengal have reported steep male–female differentials, marked alcohol co-use, and the embedding of smokeless tobacco within marital and household routines, particularly the supply of tobacco by spouses and in-laws, paralleling the spousal concordance observed here24,28,29. Earlier works from central India similarly noted that poverty does not deter tobacco consumption among tribals, and a national spatial analysis of female tobacco use identified Western and Northeastern clustering analogous to our findings25,30. What this analysis adds is the demonstration that these structural patterns persist, and partly intensify, across two NFHS rounds and across women, men, and couples, strengthening the case that the underlying drivers are structural rather than incidental. Comparable gradients reported for the general Indian population in GATS-2 indicate that tribal communities sit at the steeper end of a wider national pattern31.
Although causal inference is not possible, the consistent socioeconomic, geographical, and spousal associations observed across two nationally representative surveys provide evidence that tobacco use among tribal populations remains socially patterned. These findings identify population subgroups that may warrant further research with longitudinal and interventional study designs, which may help shape tobacco control strategies in the future. While the results are generalizable among the tribal communities in India, caution is warranted when extrapolating these findings to tribal or Indigenous populations in other countries, where sociocultural contexts, tobacco-use behaviors, and health systems may differ.
Strengths and limitations
The principal strength of this study is two nationally representative surveys with gender stratified and couplelevel modeling. Further, a four-category multinomial outcome preserves the distribution of tribal status and tobacco use and a complementary spatial level visualization of zonal patterns. The limitations include information bias due to self-reported data. Further, a cross-sectional design precludes causal inference. The observed associations may reflect reverse causation or shared household environments. NFHS does not capture nicotine dependence or cessation intensity in detail among all respondents of both genders; the spousal quit attempt was available for only a subset of couples, limiting its generalizability. Lastly, residual confounding from unmeasured behavioral and commercial determinants is likely.
CONCLUSIONS
Tobacco use among tribals in India is best understood not as an individual behavior but as the intersection of economic deprivation, rural marginalization, geographical concentration, and household-level coaggregation with alcohol, accounting for gender specific and temporal differences. Aggregate declines between NFHS-4 and NFHS-5 mask a deepening concentration of association among the poorest and most rural tribal households. Reducing this burden will likely require tobacco-control strategies that are geographically targeted at the Central, Western, and Northeastern tribal belts, integrated with alcohol-cessation services, household- and couple-oriented in design, and delivered through tribal health and welfare platforms rather than through generic national programs.