INTRODUCTION
It is estimated that there are almost 267 million tobacco users in India1. Tobacco is used in both smoking and smokeless forms with the latter being more prevalent. Though there has been a decline in the tobacco use from 34.6% in 2009–2010 to 28.6% in 2016–20172, the numbers still constitute a major burden. Every year, the mortality that has been attributed to tobacco use is close to a million, which is now projected to be 1.5 million by 20203.
While tobacco use may seem an individual’s choice or preference, the effect of social dynamics cannot be discounted4. Sociodemographic determinants have been known to influence health related behaviours, and tobacco use is no exception. It is proposed that tobacco use disproportionately affects people belonging to low socioeconomic status (SES) as they are influenced by marketing tactics, lack of awareness, access to cheap tobacco products, psychological stress etc5. The effect of SES has been reflected in the patterns of tobacco use, secondhand smoke exposure, quitting behaviour, and marketing strategies. Innovative marketing practices like packaging and promotion of tobacco products have been shown to differentially impact vulnerable populations4,6.
Kerala is a relatively small state in the southern peninsular region of India. Tobacco use in various forms including smoking and chewing has been an integral part of the social customs practiced there by several communities for centuries7. Kerala is regarded unique to other states in India in terms of having good health indicators. It is also a state with high indicators of social development. The state is presently dealing with the burden of non-communicable diseases with tobacco being a major modifiable risk factor3. Hence tobacco control and cessation are an important public health priority in the state.
The Global Adult Tobacco Survey (GATS) is an attempt towards conducting a representative nationwide survey on adult tobacco use and key tobacco control measures. The first round GATS survey was conducted in the period 2010-2011 and the latest was completed in the period 2016-2017.
The objective of this study was to explore the sociodemographic factors affecting tobacco use and its predictors in Kerala. An understanding of the sociodemographic factors affecting tobacco use can provide vital information that will help determine priorities and strategies for effective tobacco control and cessation programs.
METHODS
The study adopted a cross-sectional design. Data from the second Global Adult Tobacco Survey (GATS-2) conducted in India between 2016 and 2017 were analysed for the state of Kerala. The Global Adult Tobacco Survey (GATS), a component of Global Tobacco Surveillance System (GTSS), is a standardized global monitoring tool for tobacco use and its related indicators. It is performed on a nationally representative sample of adults aged ≥15 years with a standardized questionnaire validated by experts. Data from GATS are intended to be used by countries for planning, implementing and evaluating tobacco control interventions8.
GATS-2 India was conducted in 2017 using a multistage stratified cluster sample design. The sample size was 84047 selected households with 74037 completed individual interviews9. A total of 2186 individuals (783 males and 1403 females) from Kerala participated in GATS-29.
Selected questions in the domains of tobacco smoking, e-cigarette use, smokeless tobacco use, other tobacco product use, cessation, secondhand smoke, economics, media, knowledge, attitudes and perceptions were considered as the dependent variables and sociodemographic characteristics such as age group, gender, area of residence, marital status, religion, education level, and employment status, were included as the independent variables.
All the dependent and independent variables with multiple responses were dichotomized. Median age was calculated and accordingly grouped, employment status was grouped as ‘employed’ and ‘unemployed’, education level was categorized as ‘studied to less primary school’ and ‘studies up to primary school or above’, and marital status was grouped as ‘having a partner’ and ‘not having a partner’ (single, divorced, widowed).
Data were analyzed using IBM SPSS Version 20 software for Windows. Differences in proportions between the independent and dependent variables were tested using Pearson’s chi‑squared test. Odds ratios were calculated and are reported.
RESULTS
A total of 2186 individuals (783 men and 1403 women) participated in GATS-2 of Kerala state among which around 36% were men. About half (48.2%) of the study population lived in urban areas while 17% did not have any formal schooling or had not completed primary schooling. Of the 2186 individuals, 169 (7.7%) were current smokers, 109 (5%) were smokeless tobacco users and 30 (1.3%) used both. None of the participants reported to be using e-cigarettes. Among the smokers, more than 99% reported to use cigarettes. Use of bidis, hukkah, cigars, cheroots etc. was negligible (<1%). Similarly, use of other forms of smokeless tobacco namely gutka, mawa, mishri, gudaku etc. was also very low.
Bivariate analysis was performed for independent sociodemographic predictors of tobacco use (age, gender, education level, employment status, marital status, and area of residence).
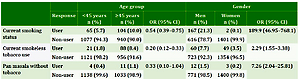
With regard to current tobacco use status, people aged <45 years were less likely to be smokers (OR=0.54; 95% CI: 0.39–0.75) and smokeless tobacco users (OR=0.20; 95% CI: 0.12–0.33) whereas it was significantly more likely to be used by men (OR=189.9; 95% CI: 46.95–768.10 for smoking, and OR=2.29; 95% CI: 1.55–3.38 for smokeless forms) (Table 1). Having no formal or less than primary schooling increased the likelihood of using tobacco (OR=2.07; 95% CI: 1.45–2.95 for smoking, and OR=5.88; 95% CI: 3.97–8.73 for smokeless tobacco) compared to people with formal schooling. Being employed increased the chances of smoking tobacco use by almost 9 times (OR=9.37; 95% CI: 6.14–14.28) (Table 2). On comparison based on marital status, it was observed that married people were more likely to use smoking tobacco (OR=2.30; 95% CI: 1.45–3.64) while unpartnered individuals were less likely to use smokeless tobacco (OR=0.62; 95% CI: 0.41–0.93). There was a statistically significant less likelihood of people dwelling in urban areas to use smokeless tobacco compared to their rural counterparts (OR=0.63; 95% CI: 0.42–0.94). However, no significant differences were noted for smoking tobacco (OR=0.86; 95% CI: 0.63–1.19) (Table 3).
Table 1
Association between tobacco use and behaviour with age group and gender, GATS (N=2186)
Table 2
Association between tobacco use and behaviour with education level and employment status, GATS (N=2186)
Table 3
Association between tobacco use and behaviour with marital status and area of residence
Mean age of initiation of smokeless tobacco use among men was 34.94 ± 19.59 years while for women it was 32.07 ± 21.94 years (p=0.55). No significant differences were also noted for the effect of education status on age of onset for smoking (less than primary schooling 22.66 ± 14.86 years, women 24.36 ± 12.19 years; p=0.50) and smokeless tobacco (less than primary schooling 30.77 ± 21.83 years, women 36.68 ± 19.27 years; p=0.21).
Although 43.8% of the smokers attempted to quit smoking in the last 12 months, there were no significant associations between quit attempts and any of the predictor variables.
Awareness regarding secondhand smoke was significantly higher among people aged <45 years and poor education status (OR=2.60; 95% CI: 1.94–3.50) (Table 1). Awareness regarding the effects of smoking and smokeless tobacco on health were consistently higher among people aged <45 years (OR=3.02; 95% CI: 2.02–4.50 for smoking, and OR=4.35; 95% CI: 3.09–6.13 for smokeless tobacco) (Table 1) and lower among participants with lower education status (OR=0.14; 95% CI: 0.10–0.21 for smoking, and OR=0.19; 95% CI: 0.14–0.26 for smokeless tobacco) (Table 2).
Compared with people who had completed primary schooling, respondents who had less than primary school or no formal education were less likely to notice health warnings on cigarette packs (OR=0.47; 95% CI: 0.35–0.63) and smokeless tobacco products (OR=0.52; 95% CI: 0.37–0.73).
DISCUSSION
Data from previous epidemiological studies have documented the role of sociodemographic factors in tobacco use behaviour10,11. This study assessed the influence that they have on the individual’s tobacco use behaviour. The findings would be useful in directing various campaigns and programmes against tobacco usage to the most vulnerable groups. The use of a standard questionnaire facilitated worthy comparisons. Smoking tobacco use was found to be 7.7%, which is less than the national average of 10.7%, while smokeless tobacco use accounted for 5%, which was considerably less than the national average of 21.5%2.
The state of Kerala has the highest literacy rate in India. It is generally agreed that the fewer the years of education, the more likely a person is a smoker. This study observes that poor education has significant association with tobacco use behaviour, age of tobacco use initiation, awareness regarding secondhand smoke, and knowledge of the detrimental health effects of tobacco. These findings are in tune with other representative sample and national surveys10,12-14. A study done in rural Gujarat observed that people with elementary and high school education levels consumed more tobacco compared to individuals with no formal education or college degree15. However, in the present study, education level was dichotomized, which meant all individuals above elementary (primary) education were considered as a single entity. Similar findings were also noted with betel quid with tobacco. ‘Supari’, as it is referred to in local parlance, was also found to have an educational differentiation in its usage16.
Older individuals (≥45 years) were more likely to use any forms of tobacco and were less likely to be aware of secondhand smoke effects. However, based on the results of National Family Health Survey-2 (1998–1999), the prevalence of tobacco consumption initially increased till the age of 50 years, and later declined10. An analysis of the GATS-1 conducted in 2010 showed that smoking was highest in the age group 50-54 years, which is in agreement with the findings of the present study11. The use of betel quid without tobacco was also significantly higher in people aged ≥45 years. This observation could probably be attributed to the cultural practice of using betel quid among the older generation in India17.
Tobacco use behaviour (both smoking and smokeless tobacco use) was significantly higher among men. This observation was expected as smoking among women is considered a taboo in Indian communities. Hence, the reporting of smoking by women could probably have been low. Comparatively higher percentage of women reported using smokeless tobacco as it is relatively acceptable in the Indian society18. While there was no statistically significant difference in the perception of men and women with regard to smoking causing serious illness, awareness regarding smokeless tobacco use causing serious illness was significantly higher among men. However, the proportion of men and women who believed tobacco use causes serious illness was high (>90%) for both smoking and smokeless forms. A study done in Pakistan reports that both men and women thought smokeless tobacco use was less harmful than smoking19. Being employed was associated with higher chances of tobacco use, as was observed in similar studies. While some studies report that unemployment was a predictor for tobacco use20, few analysed the various categories of occupations and their association with the forms of tobacco use14,21.
The urban rural differentiation was found to be significantly different in smokeless tobacco use. This is in accordance with the normative assumption that rural households use smokeless forms of tobacco where the effect of culture is still ingrained in daily living14. Lack of a significant difference in smoking tobacco use could be due to the fact that the type of smoking product was not considered. Many studies have shown a rural predilection for bidi smoking while cigarette smoking was commonly found among the urban strata13,22.
Quitting tobacco use was not found to have a significant association with any of the sociodemographic variables under consideration. This is in stark contrast to the studies done using national level GATS-1 survey, which showed strong associations with age, gender and education level among other factors23,24. The variations in the categorization of variables between the studies could have impacted the results.
Strengths and limitations
Among the strengths of the study is the use of a representative sample of the state of Kerala from the GATS survey of 2017. The study was, however, not without its limitations. Dependent variables and predictors were dichotomized for the purpose of calculating risk ratios, thus this study had its limitation in not considering categories of occupations rather than the dichotomized employed/unemployed status, due to limited data. Being a self-reported questionnaire, effect of information bias, recall bias and social desirability, to name a few, could not be ruled out.
CONCLUSIONS
The effects of sociodemographic variables (age, gender, area of residence, education level, and area of residence) were found to be associated with tobacco use behaviour in the Indian state of Kerala. Older age (≥45 years) was associated with tobacco use while poor literacy levels (less than primary schooling) and employment were significantly associated with smoking tobacco. Rural populations were more likely to use smokeless tobacco. However, the prevalence of smoking (7.7%) and smokeless tobacco use (1.3%) in Kerala was below the national average of 10.7% and 21.5%, respectively.