INTRODUCTION
The oral and systemic health effects of tobacco use, including smoking of cigarettes, cigars, and other combustible tobacco products, and smokeless tobacco are well documented1. The Surgeon General has recommended that healthcare professionals, including those in dentistry must play an active role in combatting addiction2. Engagement of health professionals in cessation counseling is such a cornerstone of preventive care that it is included in the national objectives tracked in Healthy People 20203. Objective TU-9 of HP2020 seeks to increase tobacco use screening in various healthcare settings, including those providing dental care, substance abuse care, mental health services, as well as office and hospital-based ambulatory care. In addition to screening for tobacco use within these same settings, Objective TU-10 seeks to increase delivery of counseling and education to help smokers quit. The U.S. Preventive Services Task Force (USPSTF) concluded that there is high certainty that the net benefit of tobacco screening and counseling is substantial (grade A recommendation)4.
There are several models for delivering evidence-based tobacco treatment in healthcare settings that use a Screening Brief Intervention and Referral to Treatment (SBIRT) approach. The Clinical Practice Guideline: Treatment of Tobacco Use an Dependence advocates for the use of the 5 As (Ask, Advise, Assess, Assist and Arrange)5. The Ask step includes regular assessment and documentation of tobacco use status at every visit. Advice encourages all practitioners to relate tobacco use to the presenting complaint and provide non-judgmental advice to quit. Healthcare providers then Assess patients’ level of readiness to quit and Assist patients who are ready to quit. For those patients, practitioners are urged to create a quit plan including a quit date, cessation resources and referral to treatment, and prescribe pharmacotherapy. Finally, practitioners should Arrange to follow up with patients on or around their quit date and at the next dental visit to check on progress. For patients who are not ready to quit, healthcare providers should use Motivational Interviewing techniques to help patients overcome ambivalence and move closer to taking action to quit6.
Three similar, more streamlined models of SBIRTs are Ask-Advise-Refer7, Ask-Advise-Assist8, and Ask-Advise-Connect9. In these models, practitioners provide the same Ask and Advise steps as in the 5 As, and also provide assistance to quit, arranging for follow-up care, and refer patients to a tobacco quitline in one of three ways: 1) provide a traditional referral to the patient who must initiate the call to the quitline; 2) fax a referral to the quitline which then contacts the patient; and 3) electronically transmit referral data to the quitline which allows the quitline to contact the patient more quickly. These models reduce several barriers to the provision of tobacco treatment by healthcare professionals, including lack of training, time, and reimbursement.
While several studies have examined receipt of cessation counseling at the national level, to the best of our knowledge, no study has examined state-specific estimates. More so, variations between different types of health providers in delivering smoking cessation within states are not known. This information is critical to state tobacco control programs for planning and making decisions regarding policies and programs. To fill these gaps in knowledge, this study examined changes in tobacco product use among all US adults, and receipt of cessation counseling from physicians among cigarette smokers within the 50 states and the District of Columbia (D.C.) between 2010/2011 and 2014/2015. Secondarily, we compared dentist-provided versus physicianprovided assistance to quit smoking during 2010–2011, the period data were available for both health professions. Representative data at the national and state levels were obtained from the Tobacco Use Supplement to the Current Population Survey (TUS-CPS).
METHODS
Study design and sample selection
The TUS-CPS is a household-based survey of the civilian non-institutionalized US adult population aged ≥18 years in the 50 US states and D.C. Households were probabilistically selected from mailing addresses to yield representative estimates for the nation, individual states, and other specified areas. For the 2010/2011 wave, a final pooled analytical sample of 153725 self-respondents were analyzed across all states and D.C. (pooled from May 2010, August 2010, and January 2011). For the 2014/2015 wave, a total of 163920 self-responses (pooled from July 2014, January 2015, and May 2015) were used for the analysis. Overall response rates were 62% for the 2010/2011 wave, and 54.2% for the 2014/2015 wave.
Measures
Current tobacco use
Individuals were classified as current cigarette smokers if they had smoked ≥100 cigarettes during their lifetime and smoked daily or on some days at the time of the survey. Current use of pipes, hookahs, cigars, and smokeless tobacco products, was defined as daily or some days use at the time of the survey. Current use of any tobacco product was defined as being a current user of at least one of cigarettes, pipes, hookahs, cigars, or smokeless tobacco. Current use of any combustible tobacco product was defined as being a current user of at least one of cigarettes, pipes, hookahs, or cigars.
Patient-reported visit to a physician or dentist and receipt of cessation counseling
Participants were asked: ‘In the past 12 months, have you seen a medical doctor?’ and ‘In the past 12 months, have you seen a dentist?’ (Yes/No). Visit to a dentist was assessed only in the 2010/2011 wave of TUS-CPS. Visit to a medical doctor’s office was assessed in both the 2010/2011 and 2014/2015 waves.
Current smokers who reported visiting any medical doctor or dentist, respectively, in the past 12 months were then asked: ‘During the past 12 months, did any medical doctor advise you to stop smoking?’ or ‘During the past 12 months, did any dentist advise you to stop smoking?’. Those who answered ‘Yes’ were then asked if the medical doctor or dentist had provided them with assistance to quit, as follows: ‘In the past 12 months, when a [medical doctor/dentist] advised you to quit smoking, did the [doctor/dentist] also’. Multiple choice options were identical for both medical doctors and dentists, they were as follows: 1) Suggest that you call or use a telephone help line or quit line?; 2) Suggest that you use a smoking cessation class, program, or counseling?; 3) Suggest that you set a specific date to stop smoking?; 4) Recommend or prescribe a nicotine product such as a patch, gum, lozenge, nasal spray or inhaler?; and 5) Prescribe a pill such as Chantix, Varenicline, Zyban, Bupropion, or Wellbutrin? An affirmative response to ≥1 of the five items above was classified as having received assistance to quit from a medical doctor or a dentist, as appropriate.
The questions assessing receipt of advice or assistance from a dentist or receipt of assistance from a medical doctor were asked only in the 2010/2011 wave. Therefore, comparative analyses of receipt of cessation counseling from dentist versus physician offices were restricted to the 2010/2011 wave of the survey. Comparative analyses of receipt of cessation counseling over time (between 2010/2011 and 2014/2015) was restricted to receipt of advice to quit smoking from a doctor.
US census regions
In addition to state-specific differences, we examined differences by US Census region. The following nine states were classified as Northeastern region: Connecticut, Maine, Massachusetts, New Hampshire, New Jersey, New York, Pennsylvania, Rhode Island, and Vermont. The following 12 states were classified as the Midwestern region: Illinois, Indiana, Iowa, Kansas, Michigan, Minnesota, Missouri, Nebraska, North Dakota, Ohio, South Dakota, and Wisconsin. The following 16 states, along with the District of Columbia, were classified as the Southern region: Alabama, Arkansas, Delaware, Florida, Georgia, Kentucky, Louisiana, Maryland, Mississippi, North Carolina, Oklahoma, South Carolina, Tennessee, Texas, Virginia, and West Virginia. Finally, the following 13 states were classified as the Western region: Alaska, Arizona, California, Colorado, Hawaii, Idaho, Montana, Nevada, New Mexico, Oregon, Utah, Washington, and Wyoming.
Statistical analysis
Descriptive analyses were performed with percentages and 95% confidence intervals; all data were weighted to yield representative estimates at the state, US Census region, and national levels. The denominators for analyzing both receipt of advice or assistance to quit was among those who had visited the specified health provider. Prevalence estimates with relative standard errors ≥40% are not shown. Chi-squared tests (p<0.05) were used to assess changes in prevalence between the two waves (2010/2011 and 2014/2015). All analyses were performed using R Version 3.6.1.
RESULTS
The distributions of age, sex, and race/ethnicity within each state during 2014/2015 are shown in Table 1. Between 2010/2011 and 2014/2015, prevalence of combustible tobacco smoking declined in 22 states, and prevalence of any tobacco use declined in 13 states. In three states (Maine, Mississippi, and South Carolina), smokeless tobacco use prevalence declined significantly (Table 2). However, a significant increase was observed in Arkansas (2.7% to 4.0%). All four US census regions saw significant declines in combustible tobacco smoking and all, except the Northeast, saw a decline in any tobacco use (all p<0.05).
Table 1
Characteristics of the study population by region and state, United States, 2014–2015
[i] Racial/ethnic subgroups are non-Hispanic, unless otherwise specified. Northeastern region: Connecticut, Maine, Massachusetts, New Hampshire, New Jersey, New York, Pennsylvania, Rhode Island, and Vermont. Midwestern region: Illinois, Indiana, Iowa, Kansas, Michigan, Minnesota, Missouri, Nebraska, North Dakota, Ohio, South Dakota, and Wisconsin. Southern region: Alabama, Arkansas, Delaware, Florida, Georgia, Kentucky, Louisiana, Maryland, Mississippi, North Carolina, Oklahoma, South Carolina, Tennessee, Texas, Virginia, West Virginia, and the District of Colombia (D.C.). Western region: Alaska, Arizona, California, Colorado, Hawaii, Idaho, Montana, Nevada, New Mexico, Oregon, Utah, Washington, and Wyoming.
Table 2
Changes in tobacco use by region and state between 2010–2011 and 2014–2015, United States
[i] Northeastern region: Connecticut, Maine, Massachusetts, New Hampshire, New Jersey, New York, Pennsylvania, Rhode Island, and Vermont. Midwestern region: Illinois, Indiana, Iowa, Kansas, Michigan, Minnesota, Missouri, Nebraska, North Dakota, Ohio, South Dakota, and Wisconsin. Southern region: Alabama, Arkansas, Delaware, Florida, Georgia, Kentucky, Louisiana, Maryland, Mississippi, North Carolina, Oklahoma, South Carolina, Tennessee, Texas, Virginia, West Virginia, and the District of Colombia (D.C.). Western region: Alaska, Arizona, California, Colorado, Hawaii, Idaho, Montana, Nevada, New Mexico, Oregon, Utah, Washington, and Wyoming. Current use of any tobacco product use was defined as being a current user of at least one of cigarettes, pipes, hookahs, cigars, or smokeless tobacco. Current use of any combustible tobacco product use was defined as being a current user of at least one of cigarettes, pipes, hookahs, or cigars. For the respective tobacco products, individuals were classified as current cigarette smokers if they had smoked ≥100 cigarettes during their lifetime and smoked daily or on some days at the time of the survey. Current use of pipes, hookahs, cigars, and smokeless tobacco products, was defined as daily or some days use at the time of the survey. Estimates with relative standard error ≥40% were suppressed (¶).
Overall, a relatively smaller percentage of current smokers reported a visit to a dentist than to a medical doctor in the 2010/2011 wave. The overall percentage who reported a dental visit in that period was 39.4%, and ranged from 29.0% in Texas to 54.9% in Connecticut (Table 3). Overall, during 2010/2011, 63.7% of all smokers reported a visit to a medical doctor, which ranged from 52.5% in Texas to 74.2% in Maine and Maryland (Table 4). The proportion of current cigarette smokers who visited a doctor between 2010/2011 and 2014/2015 increased significantly in 10 states and D.C.; these proportions remained unchanged in all other states.
Table 3
Percentage of current smokers who reported visiting a dentist in the past 12 months, and proportion who received cessation counseling among those who visited, 2010–2011
[i] Northeastern region: Connecticut, Maine, Massachusetts, New Hampshire, New Jersey, New York, Pennsylvania, Rhode Island, and Vermont. Midwestern region: Illinois, Indiana, Iowa, Kansas, Michigan, Minnesota, Missouri, Nebraska, North Dakota, Ohio, South Dakota, and Wisconsin. Southern region: Alabama, Arkansas, Delaware, Florida, Georgia, Kentucky, Louisiana, Maryland, Mississippi, North Carolina, Oklahoma, South Carolina, Tennessee, Texas, Virginia, West Virginia, and the District of Colombia (D.C.). Western region: Alaska, Arizona, California, Colorado, Hawaii, Idaho, Montana, Nevada, New Mexico, Oregon, Utah, Washington, and Wyoming. ‘Any assistance’ includes suggestions to use a telephone help line/quitline or a smoking cessation class/program/counseling, recommending/prescribing a nicotine product (e.g. patch, gum, lozenge, nasal spray or inhaler) or a pill (e.g. Chantix, Varenicline, Zyban, Bupropion, or Wellbutrin), and suggesting to set a specific date to stop smoking. Estimates with relative standard error ≥40% were suppressed (¶).
Table 4
Percentage of smokers who reported visiting a physician in the past 12 months, and proportion who received cessation counseling among those who visited, 2010–2011 and 2014–2015, United States
[i] Northeastern region: Connecticut, Maine, Massachusetts, New Hampshire, New Jersey, New York, Pennsylvania, Rhode Island, and Vermont. Midwestern region: Illinois, Indiana, Iowa, Kansas, Michigan, Minnesota, Missouri, Nebraska, North Dakota, Ohio, South Dakota, and Wisconsin. Southern region: Alabama, Arkansas, Delaware, Florida, Georgia, Kentucky, Louisiana, Maryland, Mississippi, North Carolina, Oklahoma, South Carolina, Tennessee, Texas, Virginia, West Virginia, and the District of Colombia (D.C.). Western region: Alaska, Arizona, California, Colorado, Hawaii, Idaho, Montana, Nevada, New Mexico, Oregon, Utah, Washington, and Wyoming. ‘Any assistance’ includes suggestions to use a telephone help line/quit line or a smoking cessation class/program/counseling, recommending/prescribing a nicotine product (e.g. patch, gum, lozenge, nasal spray or inhaler) or a pill (e.g. Chantix, Varenicline, Zyban, Bupropion, or Wellbutrin), and suggesting to set a specific date to stop smoking. Receipt of any assistance from a physician was not assessed during 2014/2015 (-). Estimates with relative standard error ≥40% were suppressed (¶).
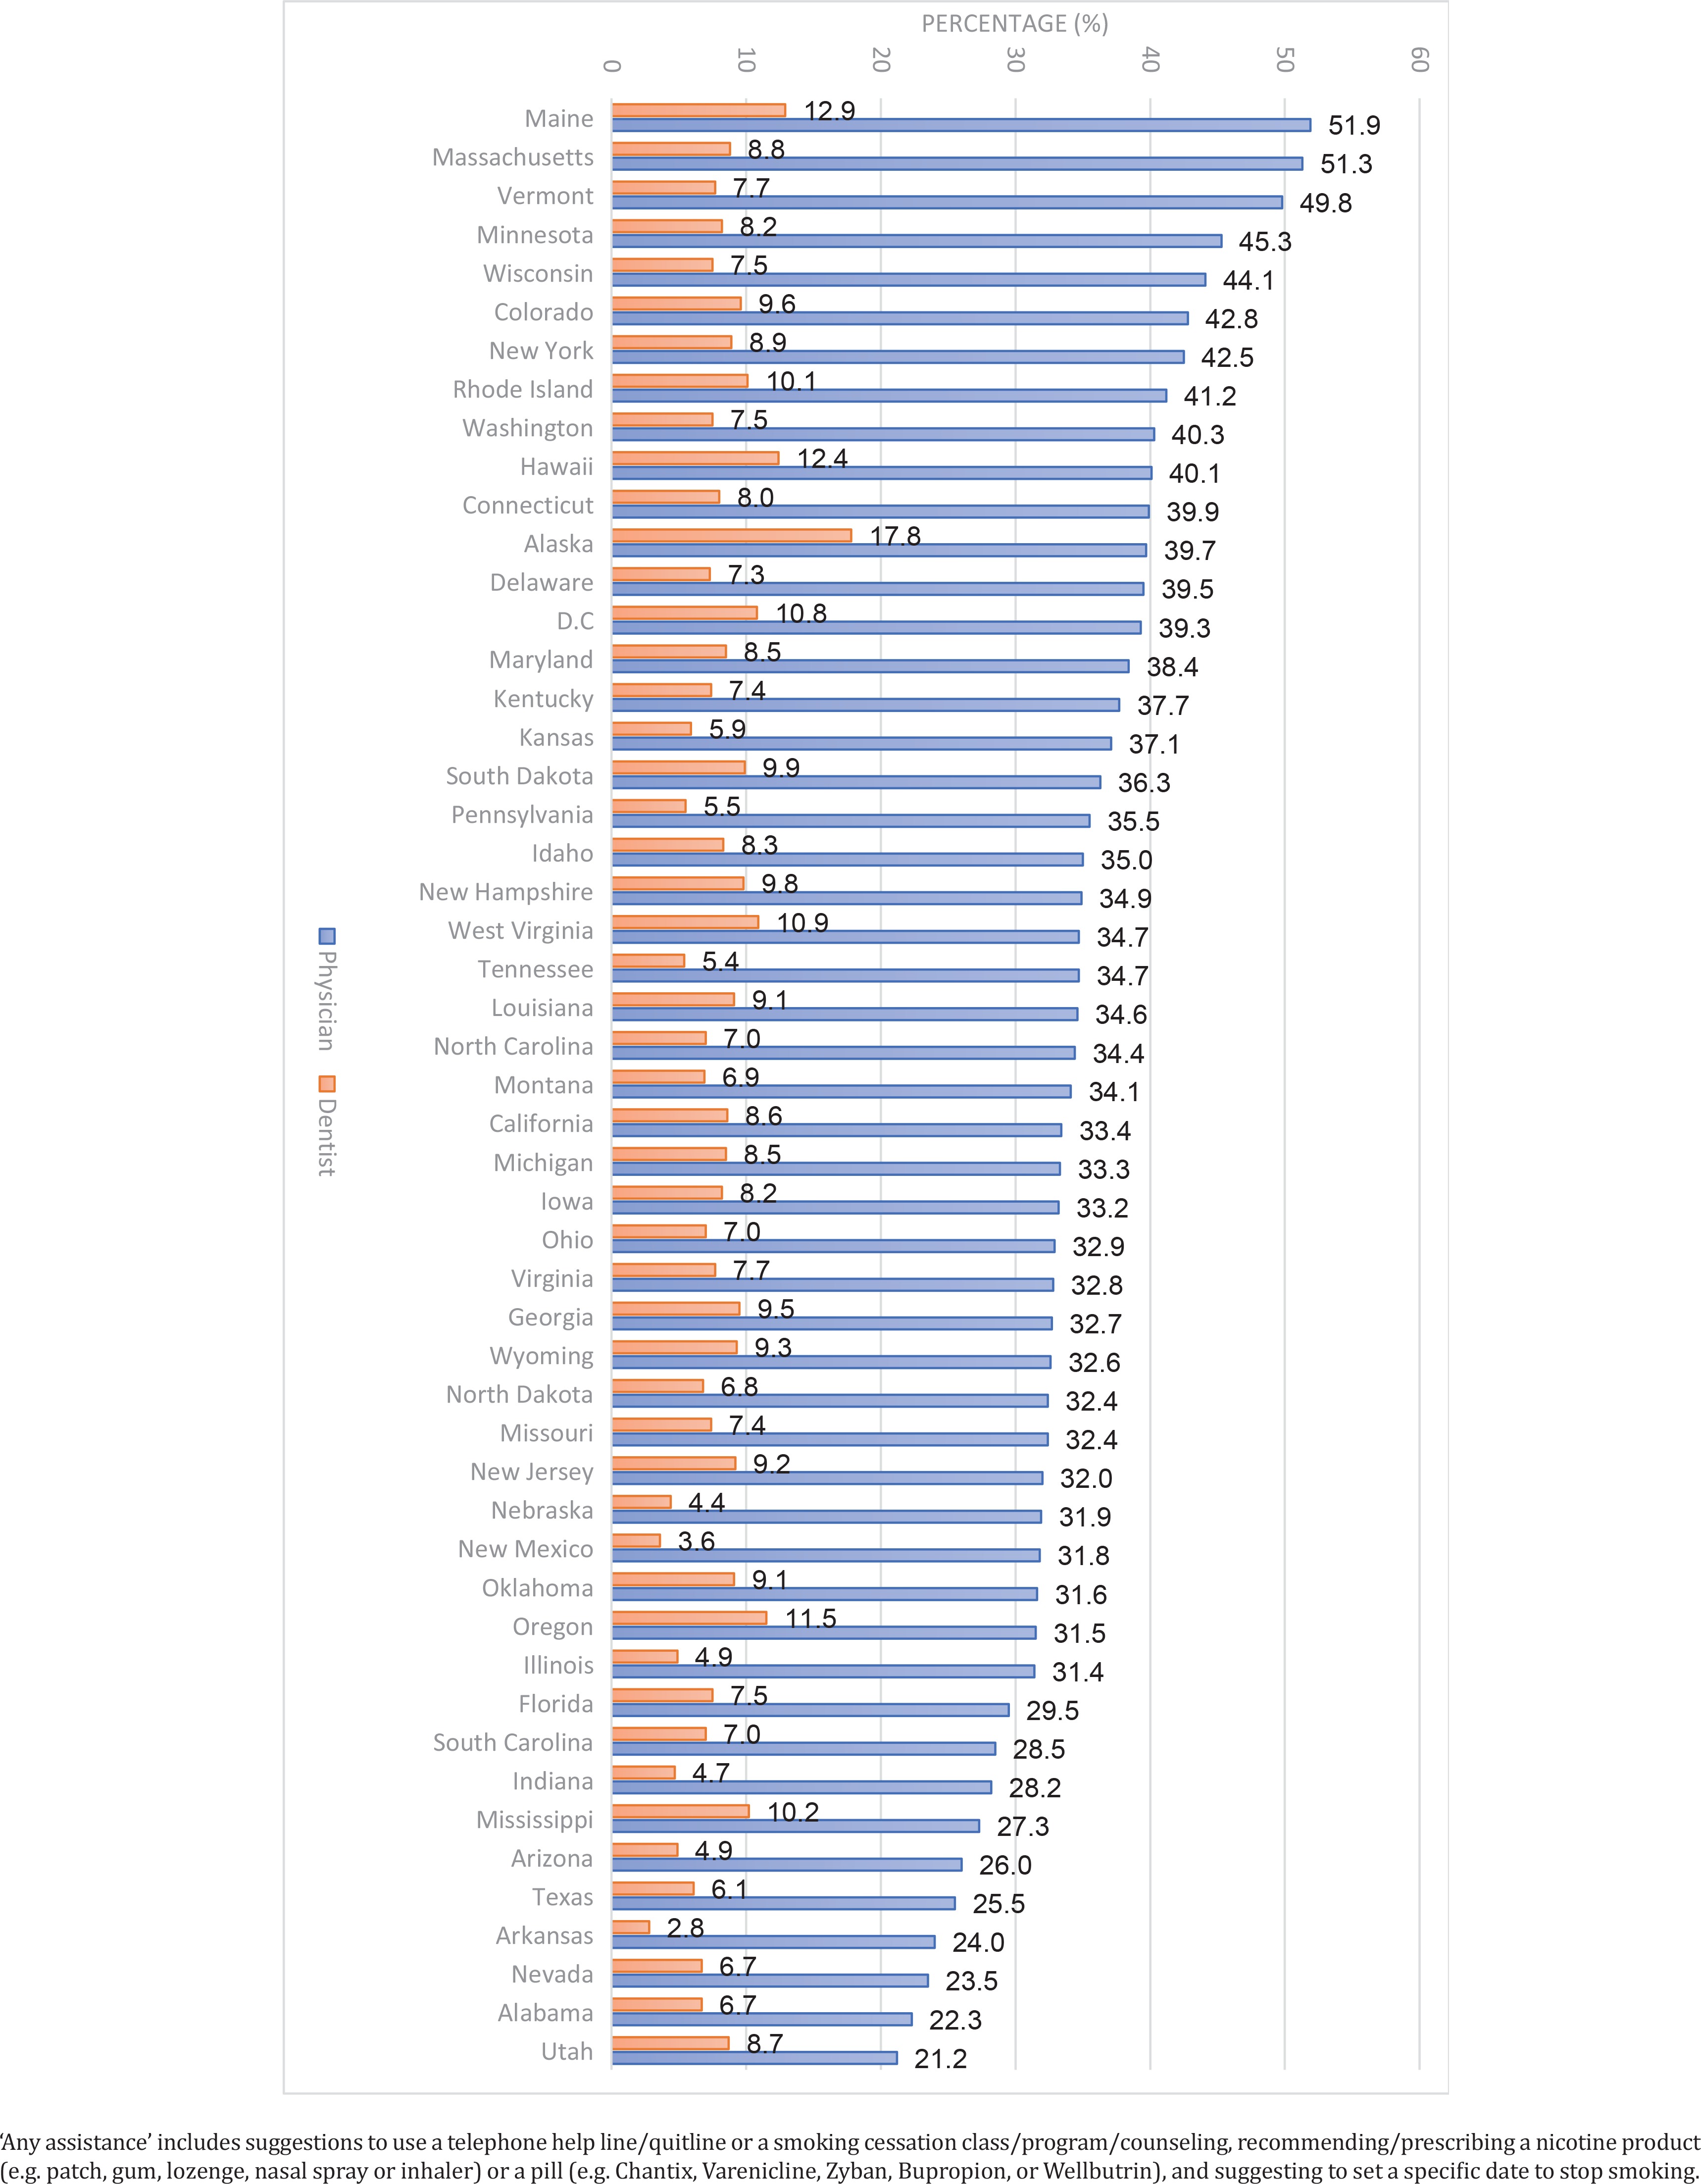
Across all states, less than a third (31.2%) of current cigarette smokers who visited a dentist during 2010/2011 were advised to quit smoking, and only 7.6% were assisted to quit (Table 3). By state, the proportion receiving dentist advice to quit ranged from 21.4% (Montana) to 38.9% (Alaska). The 10 states with the highest prevalence of receiving advice by a dentist were: South Dakota, Rhode Island, Virginia, Washington, Maryland, New York, D.C., Minnesota, Maine, and Alaska. Among those that visited a dentist, the proportion of all smokers who were assisted ranged from 4.4% (Nebraska) to 17.8% (Alaska). The 10 states with the highest prevalence of receiving assistance from a dentist were New Hampshire, South Dakota, Rhode Island, Mississippi, D.C., West Virginia, Oregon, Hawaii, Maine, and Alaska. As shown in Figure 1, receipt of assistance from a dentist during 2010/2011 was lower compared to a medical doctor in all states assessed (all p<0.05).
Figure 1
Comparison of receipt of assistance to quit smoking from dentist versus physician offices among current cigarette smokers who visited in the past 12 months, by state, 2010–2011
Among current cigarette smokers who visited a medical doctor, most states did not see a statistically significant change in the percentage of those reporting having received advice to quit between 2010/2011 and 2014/2015 (only 12 states and D.C. saw a statistically significant increase in self-reported receipt of advice to quit smoking) (Table 4). All four U.S. Census regions saw an increase in the proportion of those who were advised by a doctor to quit smoking: Northeast (69.9% to 75.3%), Midwest (65.7% to 73.1%), South (62.6% to 68.9%), and West (63.1% to 67.4%) (all p<0.05). State-specific estimates of receipt of advice during 2014/2015 ranged from 58.7% (Arkansas) to 80.7% (Wisconsin). The 10 states with the highest prevalence of receipt of advice among smokers during 2014/2015 were: Indiana, Pennsylvania, D.C., Vermont, Rhode Island, New Hampshire, Maine, Massachusetts, and Wisconsin.
DISCUSSION
We found wide variability in delivery of cessation counseling across states. Not surprisingly, most of the states with the highest prevalence of cessation counseling had the lowest prevalence of tobacco use, including states such as Massachusetts, New York, Utah, Rhode Island, and Hawaii. The gap between the highest and lowest performing states was notable. For example, the proportion of smokers who were assisted to quit by a dentist was over four-fold higher in Alaska than in Nebraska (17.8% vs 4.4%, respectively). Furthermore, over the study period, only 12 states and D.C. saw an increase in self-reported receipt of advice to quit smoking from a doctor. Intensified tobacco prevention and control efforts at the state and local levels, including funding of tobacco control programs at CDC-recommended levels, provision of tobacco cessation training to healthcare providers, and adequate reimbursement for tobacco cessation services are needed if further progress is to be made.
We found that in every state assessed, current smokers who visited a dentist were less likely to report receipt of advice or assistance to quit, compared to those who visited a physician. Visit to an oral health professional affords unique opportunities for smoking cessation and counseling, while dental records provide an excellent source of information10,11. The dental visit, especially the hygiene visit, is typically longer than a visit with a physician or nurse practitioner12. It is routine for patients to be on a periodic examination schedule, particularly those patients with tobacco-related oral health conditions such as periodontitis13. The American Dental Association (ADA), the American Dental Hygienists’ Association (ADHA), the FDI World Dental Federation, and the World Health Organization (WHO) Framework Convention for Tobacco Control (FCTC) all promote provision of evidencebased tobacco treatment by dental professionals14-17. Each member of the dental ‘team’ can play a role in the delivery of evidence-based tobacco treatment, reducing the burden on any one individual in the office and creating a supportive environment for patients who use tobacco12,18. Because of the length of the hygiene visit and the focus on education and prevention in dental hygiene practice, many dental tobacco cessation interventions rely primarily on the dental hygienist to deliver the majority of program content12,18. The dentist can reinforce the advice to quit and can play an important role in the discussion about and provision of a prescription for pharmacotherapy (e.g. Nicotine Replacement Therapy [NRT], varenicline, bupropion, etc.)18. Front office staff may also support the provision of brief interventions by collecting information about patients’ tobacco use at their initial visit and updating that information regularly. In addition, front office staff can initiate referrals to tobacco quitlines and provide information on other cessation resources to patients9,12,18-22. Through a team-based model, patients can receive multiple messages encouraging tobacco cessation, and a systematic approach to providing assistance to quit23.
With the rapidly changing landscape of tobacco use in the United States, it is critical that cessation efforts focus not only on cigarettes, but the totality of tobacco products24. During tobacco cessation counseling, it is critical to take into consideration nicotine dependence, which may affect preferences on tobacco cessation methods25. In our study, despite declines in combustible tobacco smoking in 22 states between 2010/2011 and 2014/2015, aggregate tobacco consumption decreased only in 13 states, likely because of unchanged prevalence of smokeless tobacco use in most states. Although use of electronic nicotine delivery systems (ENDS, such as electronic cigarettes) was not assessed in this study due to lack of information, US adults and youth have increasingly used ENDS in the past decade26,27. Taken together with this, our findings underscore the importance of a comprehensive strategy that covers all tobacco products at the individual and population levels, especially since not all tobacco users may visit a provider, not all who visit a provider may disclose their tobacco use status or receive advice, and not all who are counseled by a provider may make a quit attempt. Therefore, repeated exposures to health messages from numerous sources, including cigarette packaging warnings, can complement tobacco control interventions currently employed, resulting in reduced tobacco use and public health improvement28.
Limitations
The findings in this study are subject to several limitations. First, all measures were self-reported and may be subject to misclassification or misreporting. Second, small sample sizes for certain outcomes yielded imprecise estimates and were omitted. Third, data are not available for frequency of visits, or other types of providers (e.g. pharmacists, nurses, psychologists), who may be involved in providing cessation counseling. Fourth, the questions assessing receipt of advice and assistance were asked of current cigarette smokers only, and were not asked of non-cigarette tobacco product users. Finally, these data may not be representative of certain groups (e.g. institutionalized persons, military personnel, the homeless).
CONCLUSIONS
We found wide variability in delivery of cessation counseling across states for cessation counseling from a dentist or physician. Consistently across states, dental patients were less likely to receive cessation counseling than medical patients. Despite declines in combustible tobacco smoking in 22 states between 2010/2011 and 2014/2015, all tobacco consumption decreased only in 13 states. A comprehensive tobacco control strategy is necessary to improve dental public health.