
INTRODUCTION
The emergence of the omicron variant in late 2021 had marked a critical point in the trajectory of the COVID-19 pandemic1, with the new variant accounting for 40.7% of new COVID-19 cases in the United States as of 27 December 20212. New York City had been particularly hit, with the rate of new cases city-wide (287 cases/100000 population on 27 December 2021) almost four-fold higher than the national average (72.4 cases/100000 population), and the 7-day average for new confirmed cases on 25 December 2021 (20743), 14 times higher than the same time in the same city the preceding month (1485 cases)3. Among these incident COVID-19 cases include breakthrough cases in fully vaccinated people, with a total of 291880 laboratory-confirmed breakthrough cases reported cumulatively in the state of New York4. In the coming weeks to months, as vaccine coverage for COVID-19 increases even further (92% of adults in NYC currently have received ≥1 dose)5, the proportion of breakthrough COVID-19 cases may likely increase. While a booster dose is protective6, just over a quarter of the vaccinated US population is boosted2. As of 27 December 2021, a total of 66.26 million booster doses had been administered nationwide out of the 242.81 million vaccinated Americans2,3. With the ongoing shifts in population-level risk factors7,8, non-pharmacological interventions (NPI) will be increasingly important among both the vaccinated and the unvaccinated.
While much research has been done globally concerning COVID-19 vaccine hesitancy9-15, there are relatively little data on suboptimal adherence to non-pharmacological anti-contagion measures and how this varies by vaccination status, state of residence, and other sociodemographic characteristics16,17. Population educational campaigns will need insights into trends and sociodemographic characteristics of individuals with suboptimal adherence to COVID-19 NPIs to develop effective public health messages and enhance efficiency of outreach efforts. To fill this gap in knowledge, we analyzed secondary survey data from nationally and state representative samples of the US adult population during April–July 2021.
Our goals were to: a) identify trends and sociodemographic factors associated with suboptimal adherence to COVID-19 NPIs among vaccinated individuals, and b) to explore how past-7-day behaviors related to NPI measures differed between vaccinated and unvaccinated individuals.
METHODS
Data source
Data were obtained from the Household Pulse Survey (HPS), an ongoing, biweekly, national and state-specific, COVID-19-related cross-sectional survey of US adults aged ≥18 years18. The first survey cycle (‘HPS Week 1’) covered 23 April–5 May 2020. For this study, we analyzed data from six cycles across survey Weeks 28 (14 April–26 April 2021) through 33 (23 June–5 July 2021). The survey cycles before (Weeks 1–27) and after (Weeks 34–39), the specified study period did not contain the questions measuring perceived changes in public COVID-19 preventive behaviors and so were not analyzed.
Measures
COVID-19 diagnosis and vaccination status
Self-reported diagnosis of COVID-19 was defined as a response of ‘Yes’ to the question: ‘Has a doctor or other healthcare provider ever told you that you have COVID-19?’. Receipt of ≥1 dose of a COVID-19 vaccine was defined as a response of ‘Yes’ to the question: ‘Have you received a COVID-19 vaccine?’.
Public COVID-19 NPIs and other preventative measures
Participants who had received ≥1 dose of a COVID-19 vaccine were asked: ‘Since getting a COVID-19 vaccine, in general, have you increased or decreased how often you practice COVID-19 prevention behaviors when in public around people you do not know?’. Response options were: 1) I have decreased prevention behaviors since getting a vaccine; 2) I have not changed my behavior since getting a vaccine; and 3) I have increased prevention behaviors since getting a vaccine. Those responding ‘I have decreased prevention behaviors since getting a vaccine’ were classified as reporting suboptimal adherence to non-pharmacological anti-contagion measures.
All participants (vaccinated and unvaccinated) were asked: ‘In the last 7 days, have you or your household changed your spending or shopping in the following categories?’: 1) Online purchases 2) Curbside pick-up; 3) Your use of cash for purchases as opposed to cashless payment methods (e.g. credit cards, debit cards, smartphone apps); 4) In-store shopping; 5) Eating indoors at restaurants; 6) In-person medical or dental appointments; and 7) Housekeeping or caregiving services? Follow-up questions were asked of those answering in the affirmative to ascertain whether the direction of the past-7-day change represented increased or decreased activity. We recoded categories 1 to 3 above to reflect the percentage who reported more engagement in low-contact activities while categories 4–7 were recoded to reflect the percentage who reported less engagement in high-contact activities. Among those who indicated they typically used ‘bus, rail, or ride-sharing services, like Uber and Lyft’ prior to the pandemic, the survey asked: ‘In the last 7 days, have you taken fewer trips than you normally would have by bus, rail, or ride-sharing services, like Uber and Lyft, because of the coronavirus pandemic?’. Planned out-of-town trips over the next four weeks was assessed among all participants with the question: ‘During the next 4 weeks, are you planning to take any overnight trips or trips to places more than 100 miles away?’. Categorical response options for both questions above were ‘Yes’ or ‘No’.
Sociodemographic factors
We were interested in how public COVID-19 prevention behaviors varied by occupational setting, especially among those working ‘in public around people you do not know’. The survey asked: ‘Since 1 January 2021, which best describes the primary location/setting where you worked or volunteered outside your home?’. Categorical response options were: 1) Healthcare; 2) Social service; 3) Preschool or daycare; 4) K-12 school; 5) postsecondary schools; 6) First response; 7) Death care (e.g. funeral home); 8) Correctional facility; 9) Food and beverage store; 10) Agriculture, forestry, fishing, or hunting; 11) Food manufacturing facility; 12) Non-food manufacturing facility; 13) Public transit; 14) United States Postal Service (USPS); and 15) Other. Participants could also select if they did not work or volunteer ‘outside [their] home’ Other sociodemographic factors included marital status, number of children in household, US census region, race/ethnicity, gender, age, education level, and type of housing (e.g. multi-unit dwelling).
Statistical analysis
Data were weighted to yield representative estimates. Prevalence estimates were computed nationally and by state; within-group differences were assessed with two-tailed χ2 tests (p<0.05). Trends in various past-7-day behaviors related to COVID-19 prevention were assessed by vaccination status during survey Weeks 28–33; differences in trendlines between the vaccinated and the unvaccinated were tested using an interaction term between week and vaccination status. Trend analysis adjusted for marital status, children in household, US census region, race/ethnicity, gender, age, education level, and ever COVID-19 diagnosis. Exploratory logistic regression analyses were performed on the most recent survey cycle (Week 33: 23 June–5 July 2021) to assess factors associated with suboptimal adherence to COVID-19 prevention measures among the vaccinated. Independent variables assessed were household structure (marital status/children), US census region, race/ethnicity, gender, age, education level, type of housing, occupational sector, ever diagnosed of COVID-19, survey week, and whether the number of new cases in each state had been increasing or decreasing in the three weeks (1–21 June 2021) before the survey, based on state-specific data from the CDC COVID-19 tracker3. All analyses were performed in Stata Version 14.
RESULTS
Prevalence of COVID-19 vaccination coverage
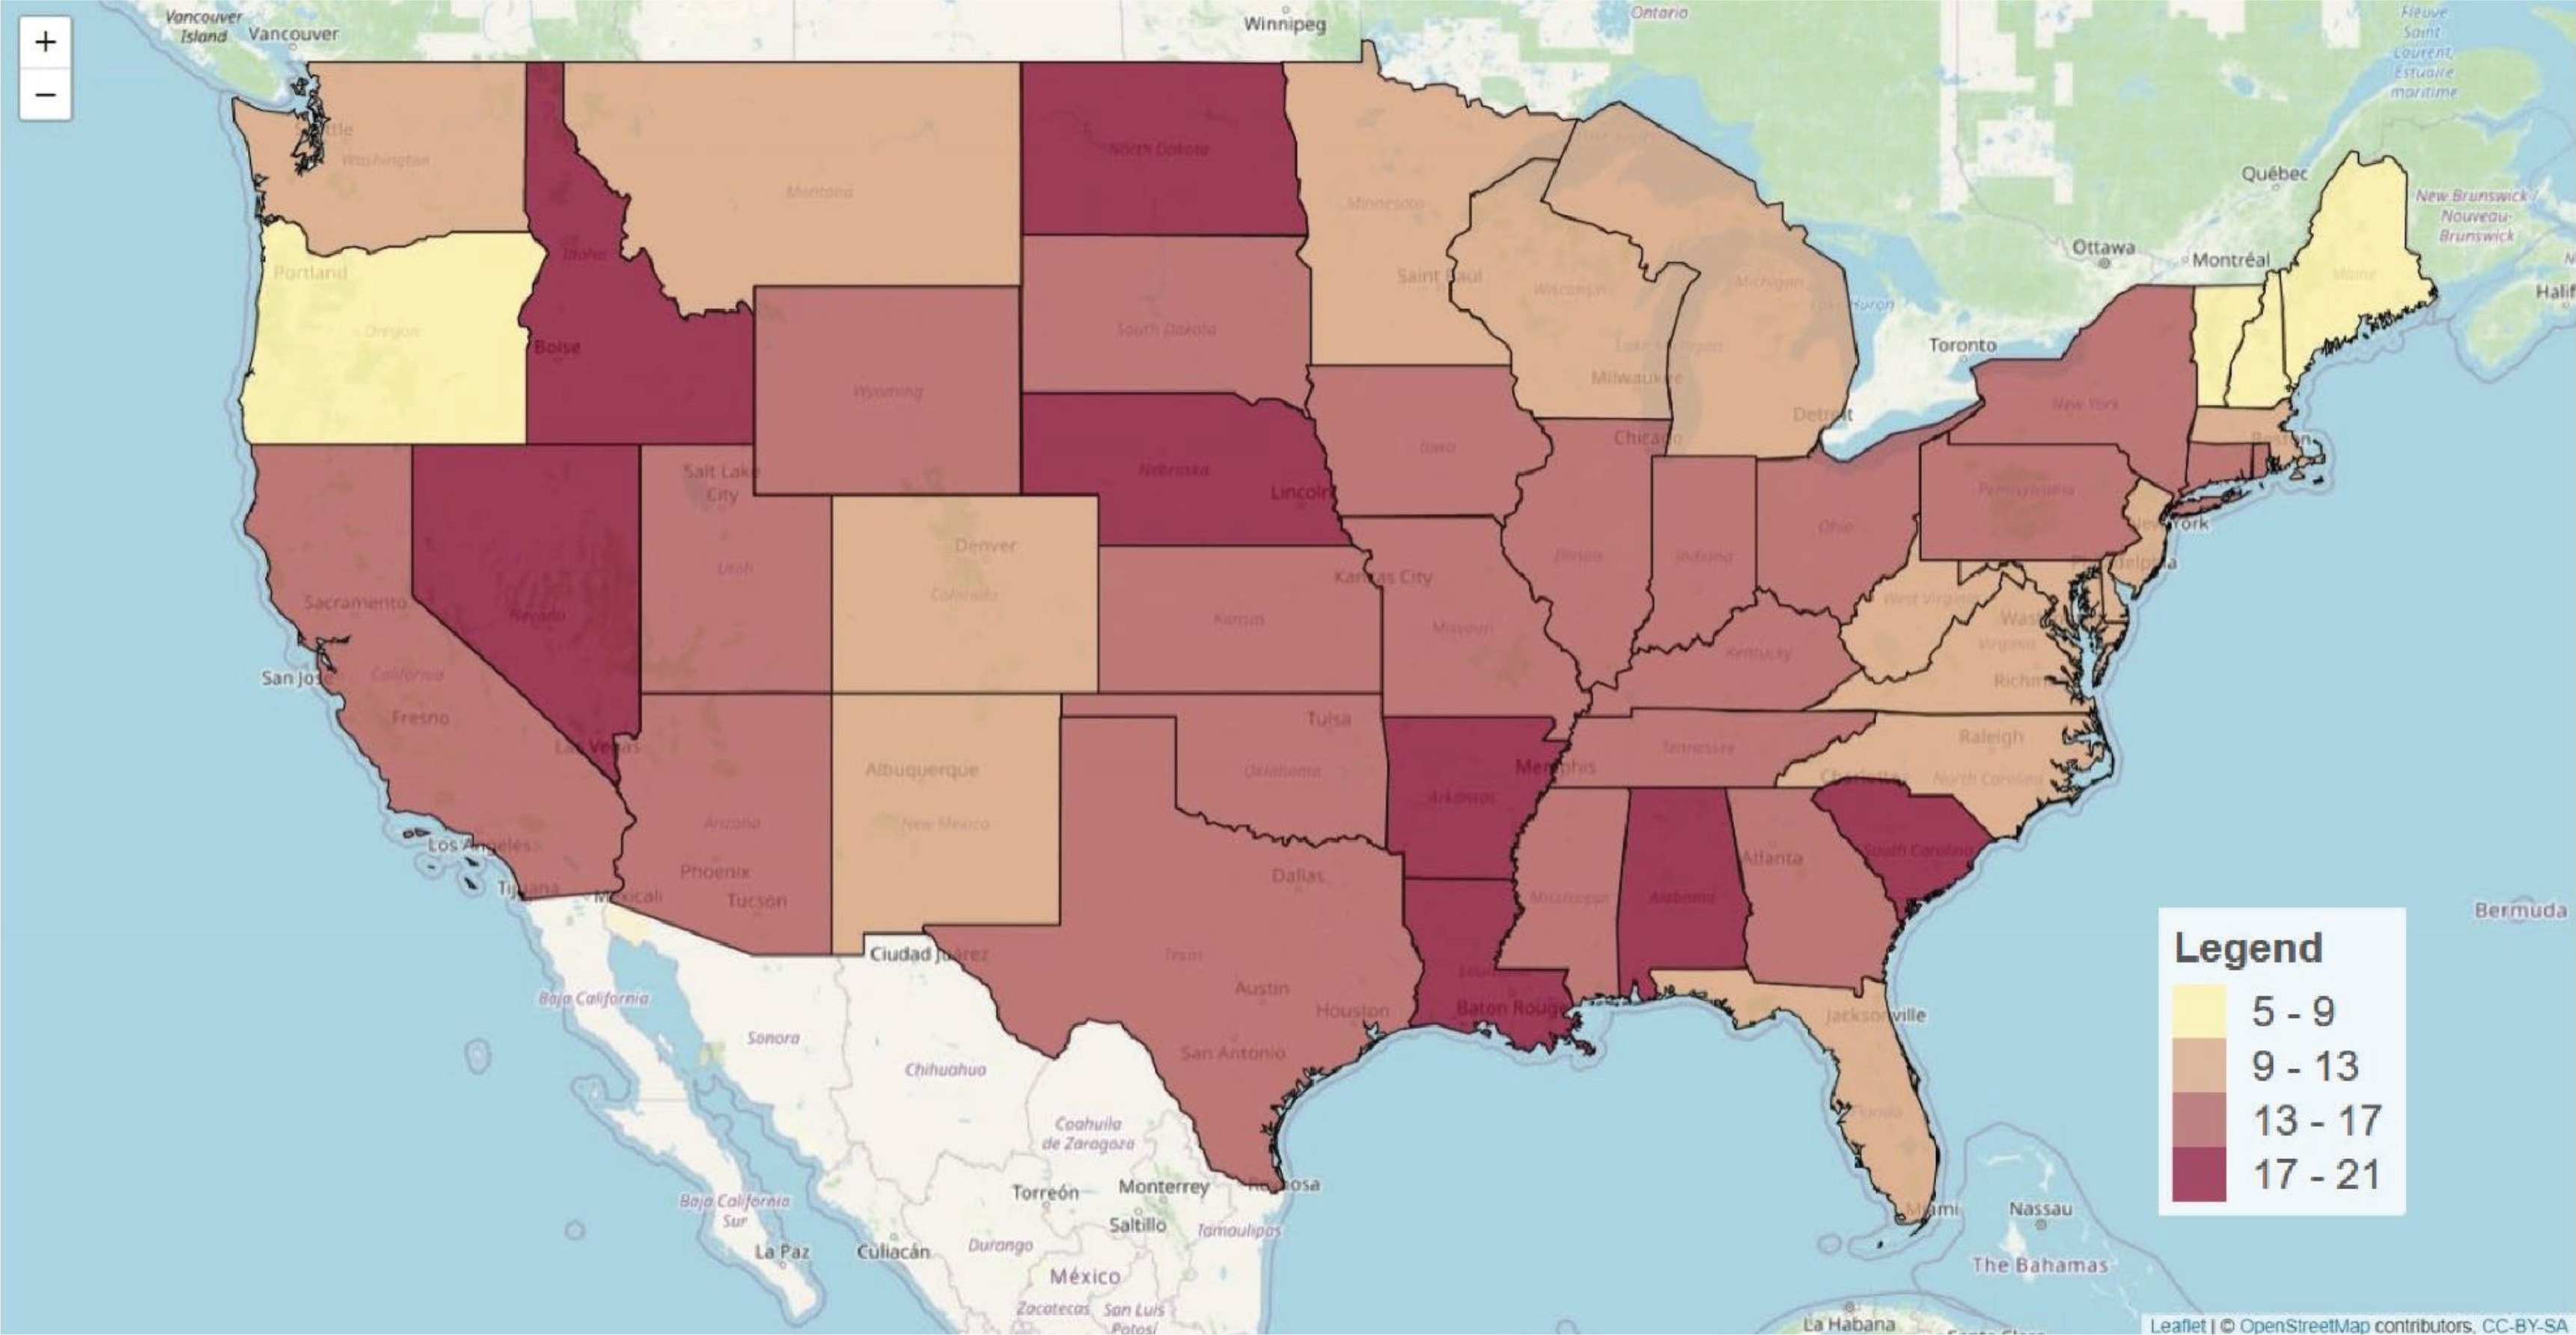
Baseline characteristics of study participants are presented in Table 1. During 23 June–5 July 2021, 13.6% of US adults reported being ever diagnosed of COVID-19, ranging from 5.0% in Hawaii to 20.5% in North Dakota; in the state of New York, prevalence was 14.0%. (Figure 1, Table 2). Of all US adults during 23 June–5 July 2021, 80.9% reported having received ≥1 dose of a COVID-19 vaccine, ranging from 93.5% in D.C. to 60.1% in Wyoming; in the state of New York, prevalence was 83.0%. By US census region, vaccination prevalence was highest in the Northeast (85.1%) and lowest in the South (77.1%). By age, vaccination was highest among those aged ≥65 years, and lowest among those aged 25–44 years (72.3%). Individuals with a graduate degree reported the highest prevalence of vaccination (93.0%), while those with <high school education reported the lowest (70.9%). Single adults with a child in the household reported the lowest prevalence of vaccination (61.7%) while married persons with no children reported the highest prevalence (89.0%). By housing type, those living in a mobile home reported the lowest prevalence of vaccination (66.9%), whereas those living in condominiums had the highest prevalence (86.0%). By annual household income (US$), prevalence was lowest among those earning <25000 (70.6%) and highest among those earning ≥200000 (92.5%) (all p<0.05).
Table 1
Percentage of US adults ever diagnosed of, ever vaccinated against, and percentage of the vaccinated reporting reduced adherence to COVID-19 prevention behaviors since their vaccination, overall and by selected demographic characteristics, 2021
| Characteristics | Distributions, all participants | Ever diagnosed of COVID-19 by a doctor, all participants | Ever received a COVID-19 vaccine, all participants | Suboptimal adherence to COVID-19 prevention behaviors over time, among the vaccinated | |
|---|---|---|---|---|---|
| Week 33 23 June–5 July % (n) | Week 33 23 June–5 July % (95% CI) | Week 33 23 June–5 July % (95% CI) | Week 28 14 April–26 April % (95% CI) | Week 33 23 June–5 July % (95% CI) | |
| 100 (66262) | 13.6 (13.0–14.2) | 80.9 (80.2–81.6) | 10.1 (9.6–10.5) | 52.5 (51.6–53.4) | |
| Number of people living with respondent | |||||
| 0 (i.e. lives alone) | 7.9 (11558) | 9.7 (8.7–10.8) | 84.5 (83.0–85.9) | 9.9 (8.8–10.9) | 52.5 (50.6–54.3) |
| 1 | 31.7 (26010) | 11.2 (10.5–12.0) | 87.6 (86.8–88.3) | 11.4 (10.6–12.1) | 57.6 (56.3–58.8) |
| 2 | 19.7 (11011) | 13.6 (12.3–14.8) | 80.1 (78.5–81.7) | 8.5 (7.5–9.6) | 51.9 (50.0–53.8) |
| 3 | 18.9 (9993) | 14.5 (13.2–15.8) | 79.5 (77.9–81.1) | 10.3 (9.0–11.5) | 53.6 (51.5–55.7) |
| ≥4 | 21.9 (7690) | 17.6 (15.7–19.4) | 72.0 (69.9–74.2) | 9.0 (7.7–10.3) | 43.1 (40.4–45.7) |
| US census region | |||||
| Northeast | 17.1 (10223) | 12.6 (11.1–14.1) | 85.1 (83.3–86.9) | 9.0 (7.7–10.2) | 55.0 (52.7–57.2) |
| South | 38.4 (21186) | 14.3 (13.3–15.3) | 77.1 (75.9–78.3) | 10.6 (9.8–11.4) | 51.6 (50.1–53.2) |
| Midwest | 20.6 (13297) | 13.7 (12.6–14.7) | 80.0 (78.6–81.4) | 9.8 (8.9–10.7) | 62.5 (60.7–64.2) |
| West | 24.0 (21556) | 13.0 (11.8–14.3) | 84.7 (83.4–86.1) | 10.3 (9.3–11.3) | 43.9 (42.2–45.6) |
| Race/ethnicity | |||||
| White, non-Hispanic | 66.0 (51767) | 12.0 (11.5–12.6) | 81.3 (80.5–82.0) | 11.8 (11.2–12.4) | 63.6 (62.7–64.5) |
| Hispanic | 17.2 (6045) | 21.2 (18.9–23.5) | 80.7 (78.6–82.8) | 7.5 (6.2–8.9) | 32.0 (29.4–34.7) |
| Black, non-Hispanic | 11.4 (5105) | 13.5 (11.8–15.3) | 72.7 (69.9–75.4) | 4.7 (3.6–5.9) | 25.2 (22.6–27.7) |
| Asian, non-Hispanic | 5.4 (3345) | 8.5 (6.4–10.7) | 94.1 (92.1–96.1) | 6.2 (4.9–7.5) | 34.8 (31.6–37.9) |
| Gender | |||||
| Male | 48.4 (27109) | 12.6 (11.6–13.5) | 81.4 (80.2–82.5) | 10.7 (9.9–11.5) | 54.1 (52.6–55.5) |
| Female | 51.6 (39153) | 14.5 (13.8–15.2) | 80.5 (79.6–81.3) | 9.4 (8.9–10.0) | 51.0 (49.9–52.1) |
| Age (years) | |||||
| 18–24 | 8.2 (1716) | 14.2 (11.7–16.6) | 74.0 (70.5–77.5) | 11.6 (8.7–14.4) | 55.4 (50.5–60.2) |
| 25–44 | 35.8 (19085) | 15.3 (14.1–16.5) | 72.3 (70.9–73.7) | 12.0 (11.0–12.9) | 54.7 (53.1–56.4) |
| 45–64 | 33.8 (26106) | 14.5 (13.6–15.4) | 83.7 (82.8–84.7) | 8.8 (8.0–9.6) | 50.6 (49.2–51.9) |
| ≥65 | 22.2 (19355) | 9.1 (8.1–10.0) | 93.0 (92.0–94.0) | 9.3 (8.5–10.0) | 51.4 (49.8–53.0) |
| Education level | |||||
| < High school | 8.0 (1338) | 16.2 (13.0–19.5) | 70.9 (66.7–75.2) | 7.9 (5.1–10.7) | 24.5 (20.3–28.7) |
| High school graduate | 30.9 (7625) | 13.6 (12.2–15.0) | 74.3 (72.7–76.0) | 6.9 (5.8–8.0) | 45.6 (43.5–47.7) |
| Some college | 21.0 (13946) | 15.2 (14.1–16.3) | 79.2 (77.9–80.4) | 9.1 (8.1–10.2) | 51.1 (49.4–52.8) |
| Associate degree | 9.3 (6959) | 15.4 (14.0–16.8) | 80.4 (78.8–82.0) | 8.0 (6.9–9.1) | 51.4 (49.2–53.6) |
| College degree | 16.9 (18955) | 12.0 (11.2–12.8) | 90.0 (89.2–90.7) | 13.1 (12.2–14.0) | 63.6 (62.3–64.9) |
| Graduate degree | 13.9 (17439) | 10.2 (9.4–11.0) | 93.0 (92.4–93.7) | 14.5 (13.6–15.3) | 65.9 (64.7–67.1) |
| Household structure | |||||
| Married, no children in household | 31.8 (23416) | 12.3 (11.3–13.2) | 89.0 (88.1–90.0) | 10.6 (9.8–11.3) | 56.5 (55.1–57.9) |
| Married, ≥1 child in household | 23.7 (15125) | 15.4 (14.3–16.6) | 77.1 (75.6–78.6) | 10.3 (9.3–11.2) | 54.9 (53.2–56.6) |
| Widowed/divorced/separated, no children in household | 11.5 (11118) | 11.2 (9.9–12.4) | 84.4 (82.7–86.1) | 8.2 (7.1–9.3) | 46.4 (44.4–48.5) |
| Widowed/divorced/separated, ≥1 child in household | 6.3 (3918) | 15.4 (12.8–17.9) | 72.1 (68.8–75.4) | 6.0 (4.6–7.4) | 42.4 (38.6–46.1) |
| Single, no children in household | 17.2 (9155) | 13.4 (11.6–15.2) | 81.5 (79.8–83.3) | 11.8 (10.2–13.4) | 53.6 (51.0–56.2) |
| Single, ≥1 child in household | 8.5 (2841) | 15.7 (13.2–18.2) | 61.7 (58.3–65.1) | 8.8 (6.6–11.0) | 40.9 (36.5–45.3) |
| Unknown marital status | 1.0 (689) | 11.2 (6.4–16.0) | 78.5 (71.5–85.6) | 10.1 (5.5–14.7) | 32.8 (24.0–41.6) |
| Annual household income (US$) | |||||
| <25000 | 9.5 (4992) | 14.0 (11.2–16.7) | 70.6 (67.7–73.4) | 7.0 (5.3–8.7) | 33.0 (30.0–36.1) |
| 25000–49999 | 15.3 (9106) | 14.0 (12.5–15.5) | 76.5 (74.5–78.5) | 7.8 (6.3–9.2) | 42.4 (40.1–44.7) |
| 50000–99999 | 20.5 (15350) | 13.4 (12.3–14.5) | 84.3 (83.1–85.5) | 9.5 (8.5–10.4) | 54.6 (52.7–56.4) |
| 100000–199999 | 15.2 (13552) | 12.1 (10.9–13.3) | 89.3 (88.1–90.5) | 12.0 (11.0–13.0) | 65.2 (63.3–67.0) |
| ≥200000 | 5.3 (5368) | 8.3 (7.1–9.5) | 92.5 (91.0–94.0) | 15.6 (14.0–17.3) | 72.5 (70.3–74.7) |
| Unknown income | 34.2 (17894) | 14.9 (13.7–16.0) | 78.1 (76.7–79.5) | 10.0 (9.1–10.9) | 50.2 (48.4–51.9) |
| Type of housing | |||||
| Mobile housinga | 3.3 (1866) | 13.6 (11.0–16.3) | 66.9 (62.9–70.8) | 7.2 (4.9–9.6) | 40.1 (35.3–44.9) |
| A one-family house detached from any other house | 49.2 (36572) | 12.8 (12.1–13.6) | 83.4 (82.5–84.3) | 10.4 (9.8–11.0) | 56.6 (55.5–57.8) |
| A one-family house attached to one or more houses | 5.4 (4188) | 14.1 (11.2–16.9) | 86.0 (83.3–88.6) | 8.9 (7.3–10.6) | 46.8 (43.0–50.7) |
| Multi-unit apartment | 12.9 (8921) | 13.2 (11.5–14.9) | 79.2 (77.0–81.3) | 9.7 (8.3–11.1) | 46.7 (44.3–49.1) |
| Unknown housing | 29.2 (14715) | 14.9 (13.7–16.1) | 78.1 (76.6–79.6) | 10.1 (9.1–11.2) | 49.8 (47.9–51.7) |
Table 2
Percentage of US adults ever diagnosed of, ever vaccinated against, and percentage of the vaccinated reporting reduced adherence to COVID-19 prevention behaviors since their vaccination, by state, 2021
Changes in suboptimal adherence to COVID-19 prevention measures among the vaccinated
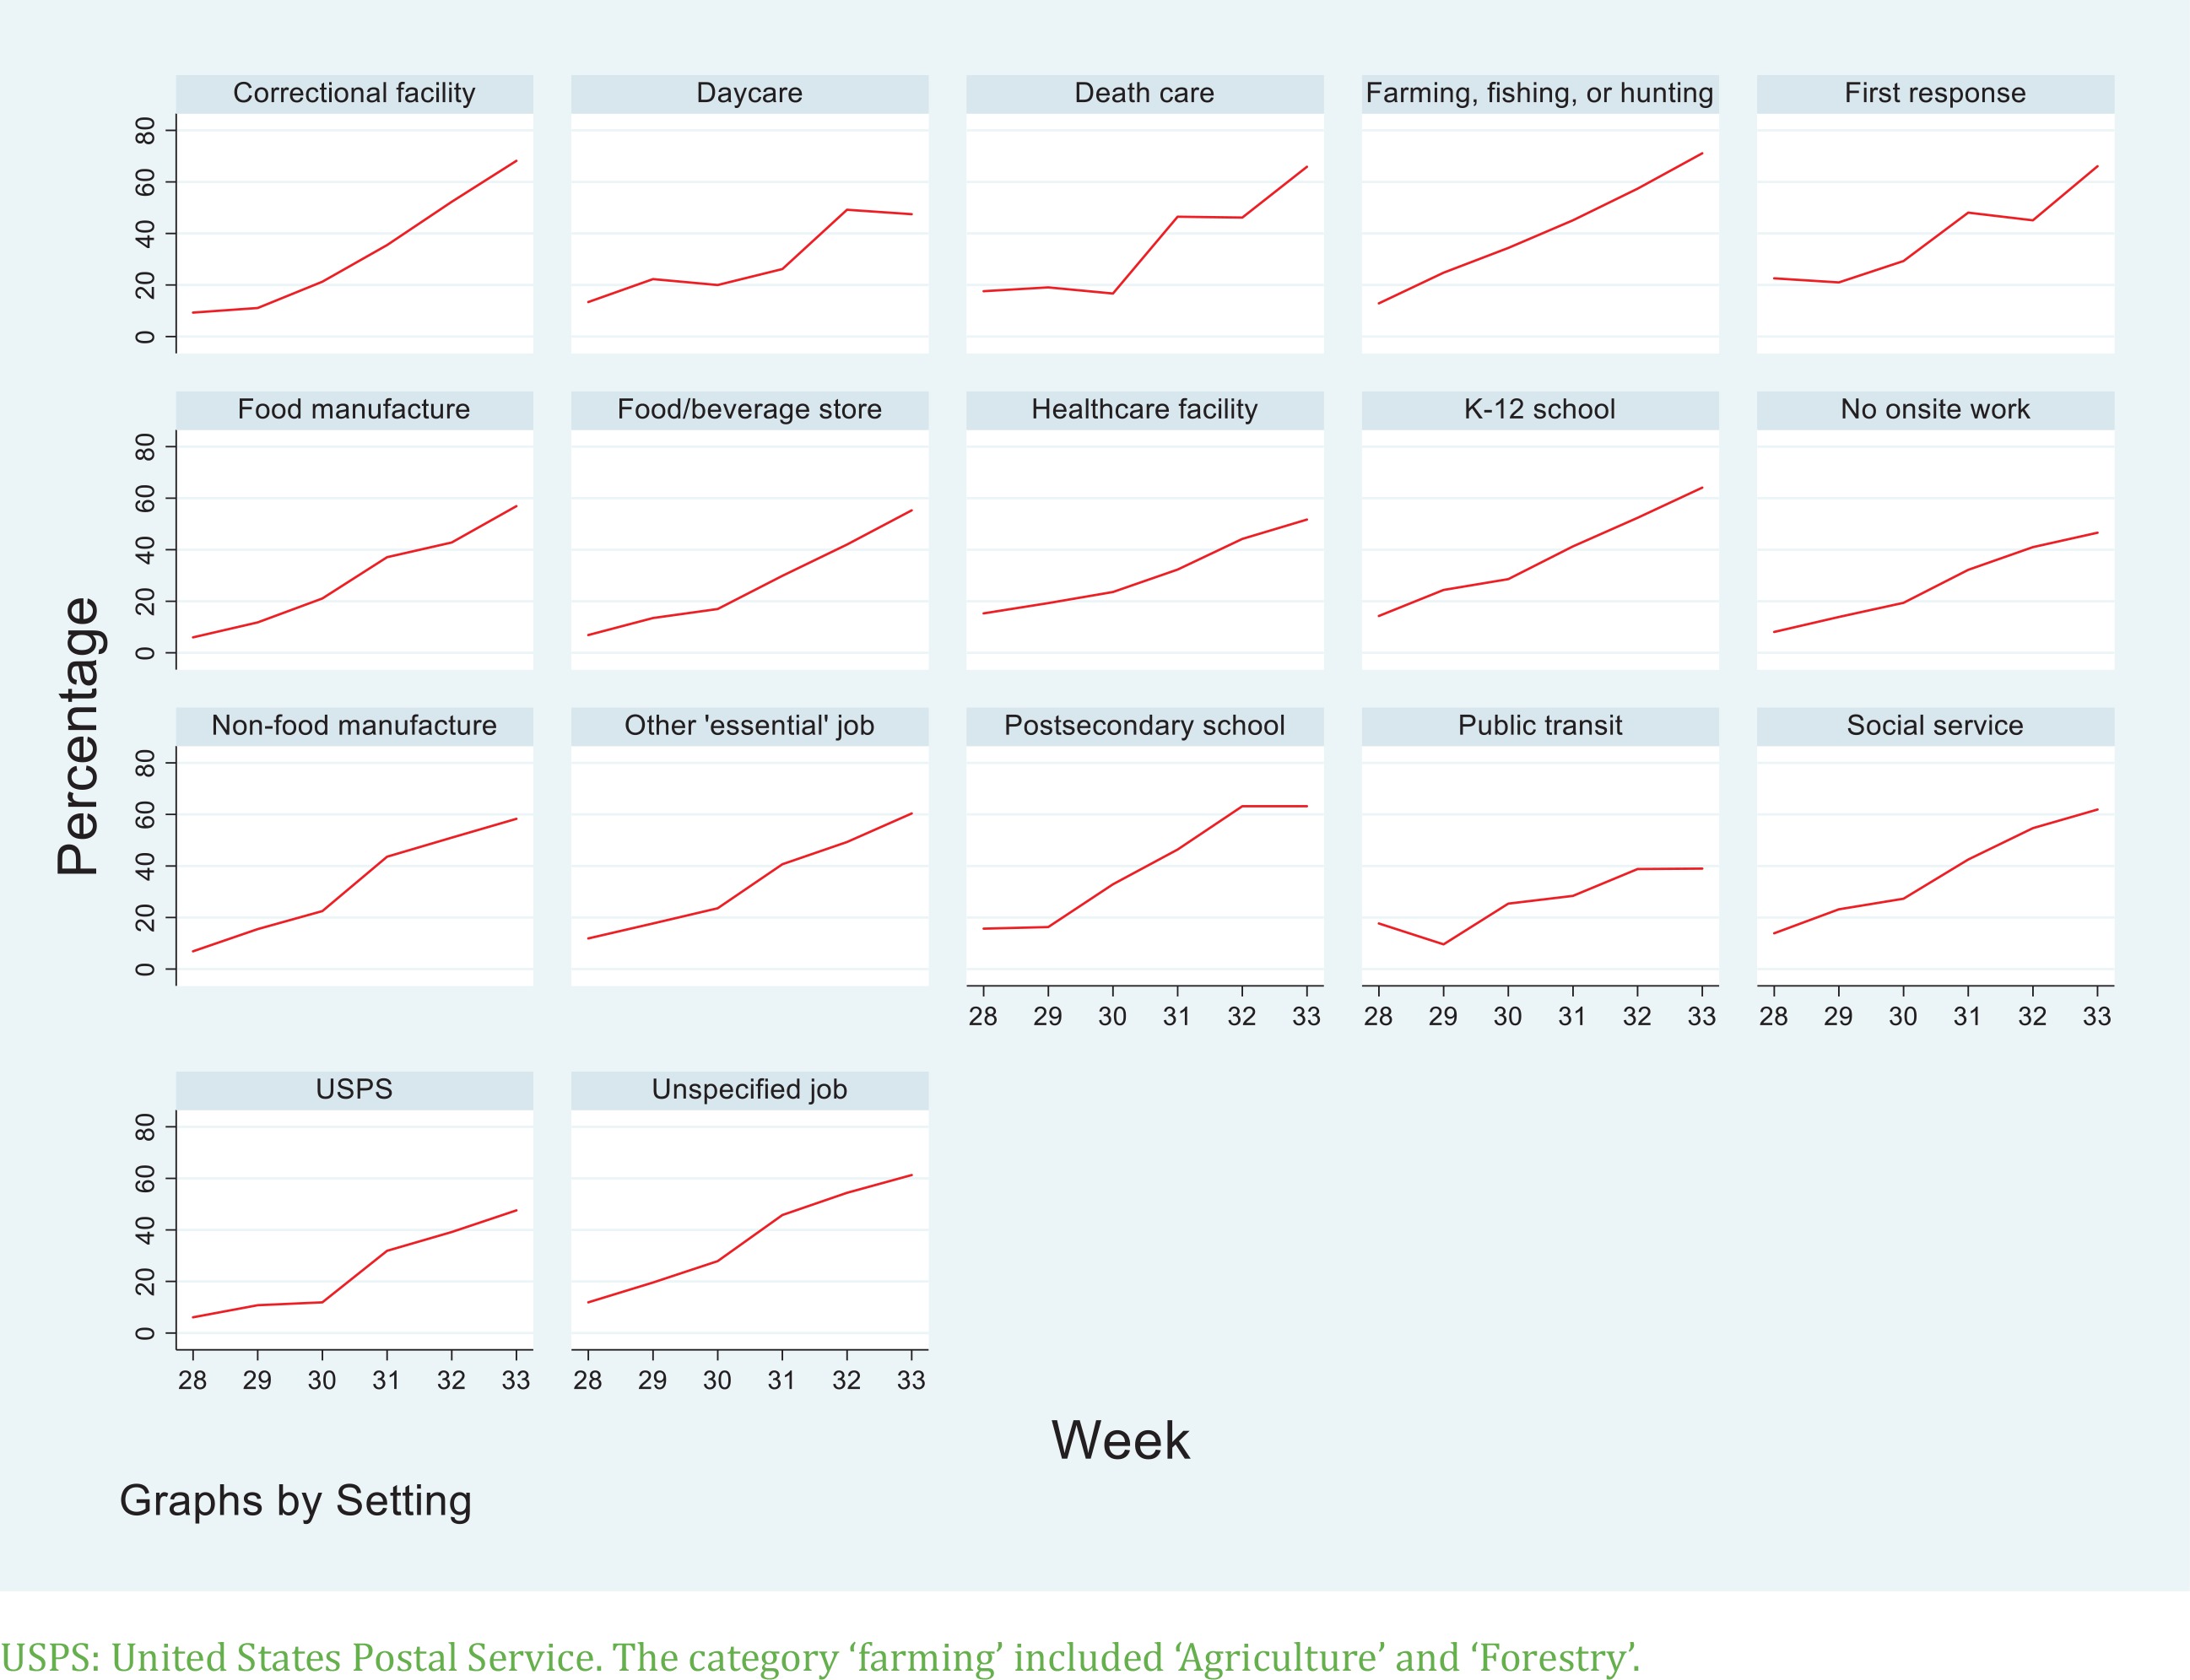
Of vaccinated adults surveyed during the most recent cycle spanning 23 June–5 July 2021, 43.2% reported they had not changed their COVID-19 preventive behavior since getting a vaccine, 52.5% reported they had since decreased their COVID-19 prevention behaviors, while 4.3% indicated that they had since increased their COVID-19 prevention behaviors. Within trend analysis over the six survey cycles spanning 14 April–5 July 2021 (i.e. survey Weeks 28–33), the percentage of all vaccinated adults who reported suboptimal adherence to public COVID-19 prevention behaviors increased five-fold over the entire period, from 10.1% in Week 28, to the observed 52.5% in Week 33 (p<0.01). Significant increases occurred in all 50 US states and D.C., with some of the largest relative increases from baseline seen in Maine (5.1%–71.4%), Vermont (6.0%–72.8%), Delaware (5.1%–57.3%), Minnesota (7.6%–72.5%), Massachusetts (7.7% – 66.4%), Rhode Island (7.3%–62.2%), Michigan (6.7%–54.6%), Connecticut (7.3%–56.5%), Wisconsin (9.1%–67.6%), and Ohio (9.4%–68.0%) (Figure 2, all p<0.01). Trends by occupational setting were as follows as shown in Figure 3: food manufacture (6.0%–56.9%), non-food manufacture (6.9%–58.3%), retailers at food/beverage stores (6.9%–55.3%), USPS (6.1%–47.6%), agriculture/forestry/fishing/hunting (12.9%–71.1%), K-12 schools (14.3%–64.1%), social service workers (13.9%–64.1%), postsecondary school personnel (15.7%–63.2%), deathcare workers (17.6%–65.9%), daycare workers (13.4%–47.5%), healthcare workers (15.3%–51.7%), first responders (22.6%–66.1%), and public transit workers (17.7%– 39.0%) (all p< 0.01). Among those who reported not working or volunteering outside their home, suboptimal adherence increased from 8.1% to 46.6% (p<0.01).
Figure 2
Increasing poor adherence to COVID-19 prevention behaviors among vaccinated US adults during survey Weeks 28–33 of the Household Pulse Survey (14 April–5 July 2021), by state
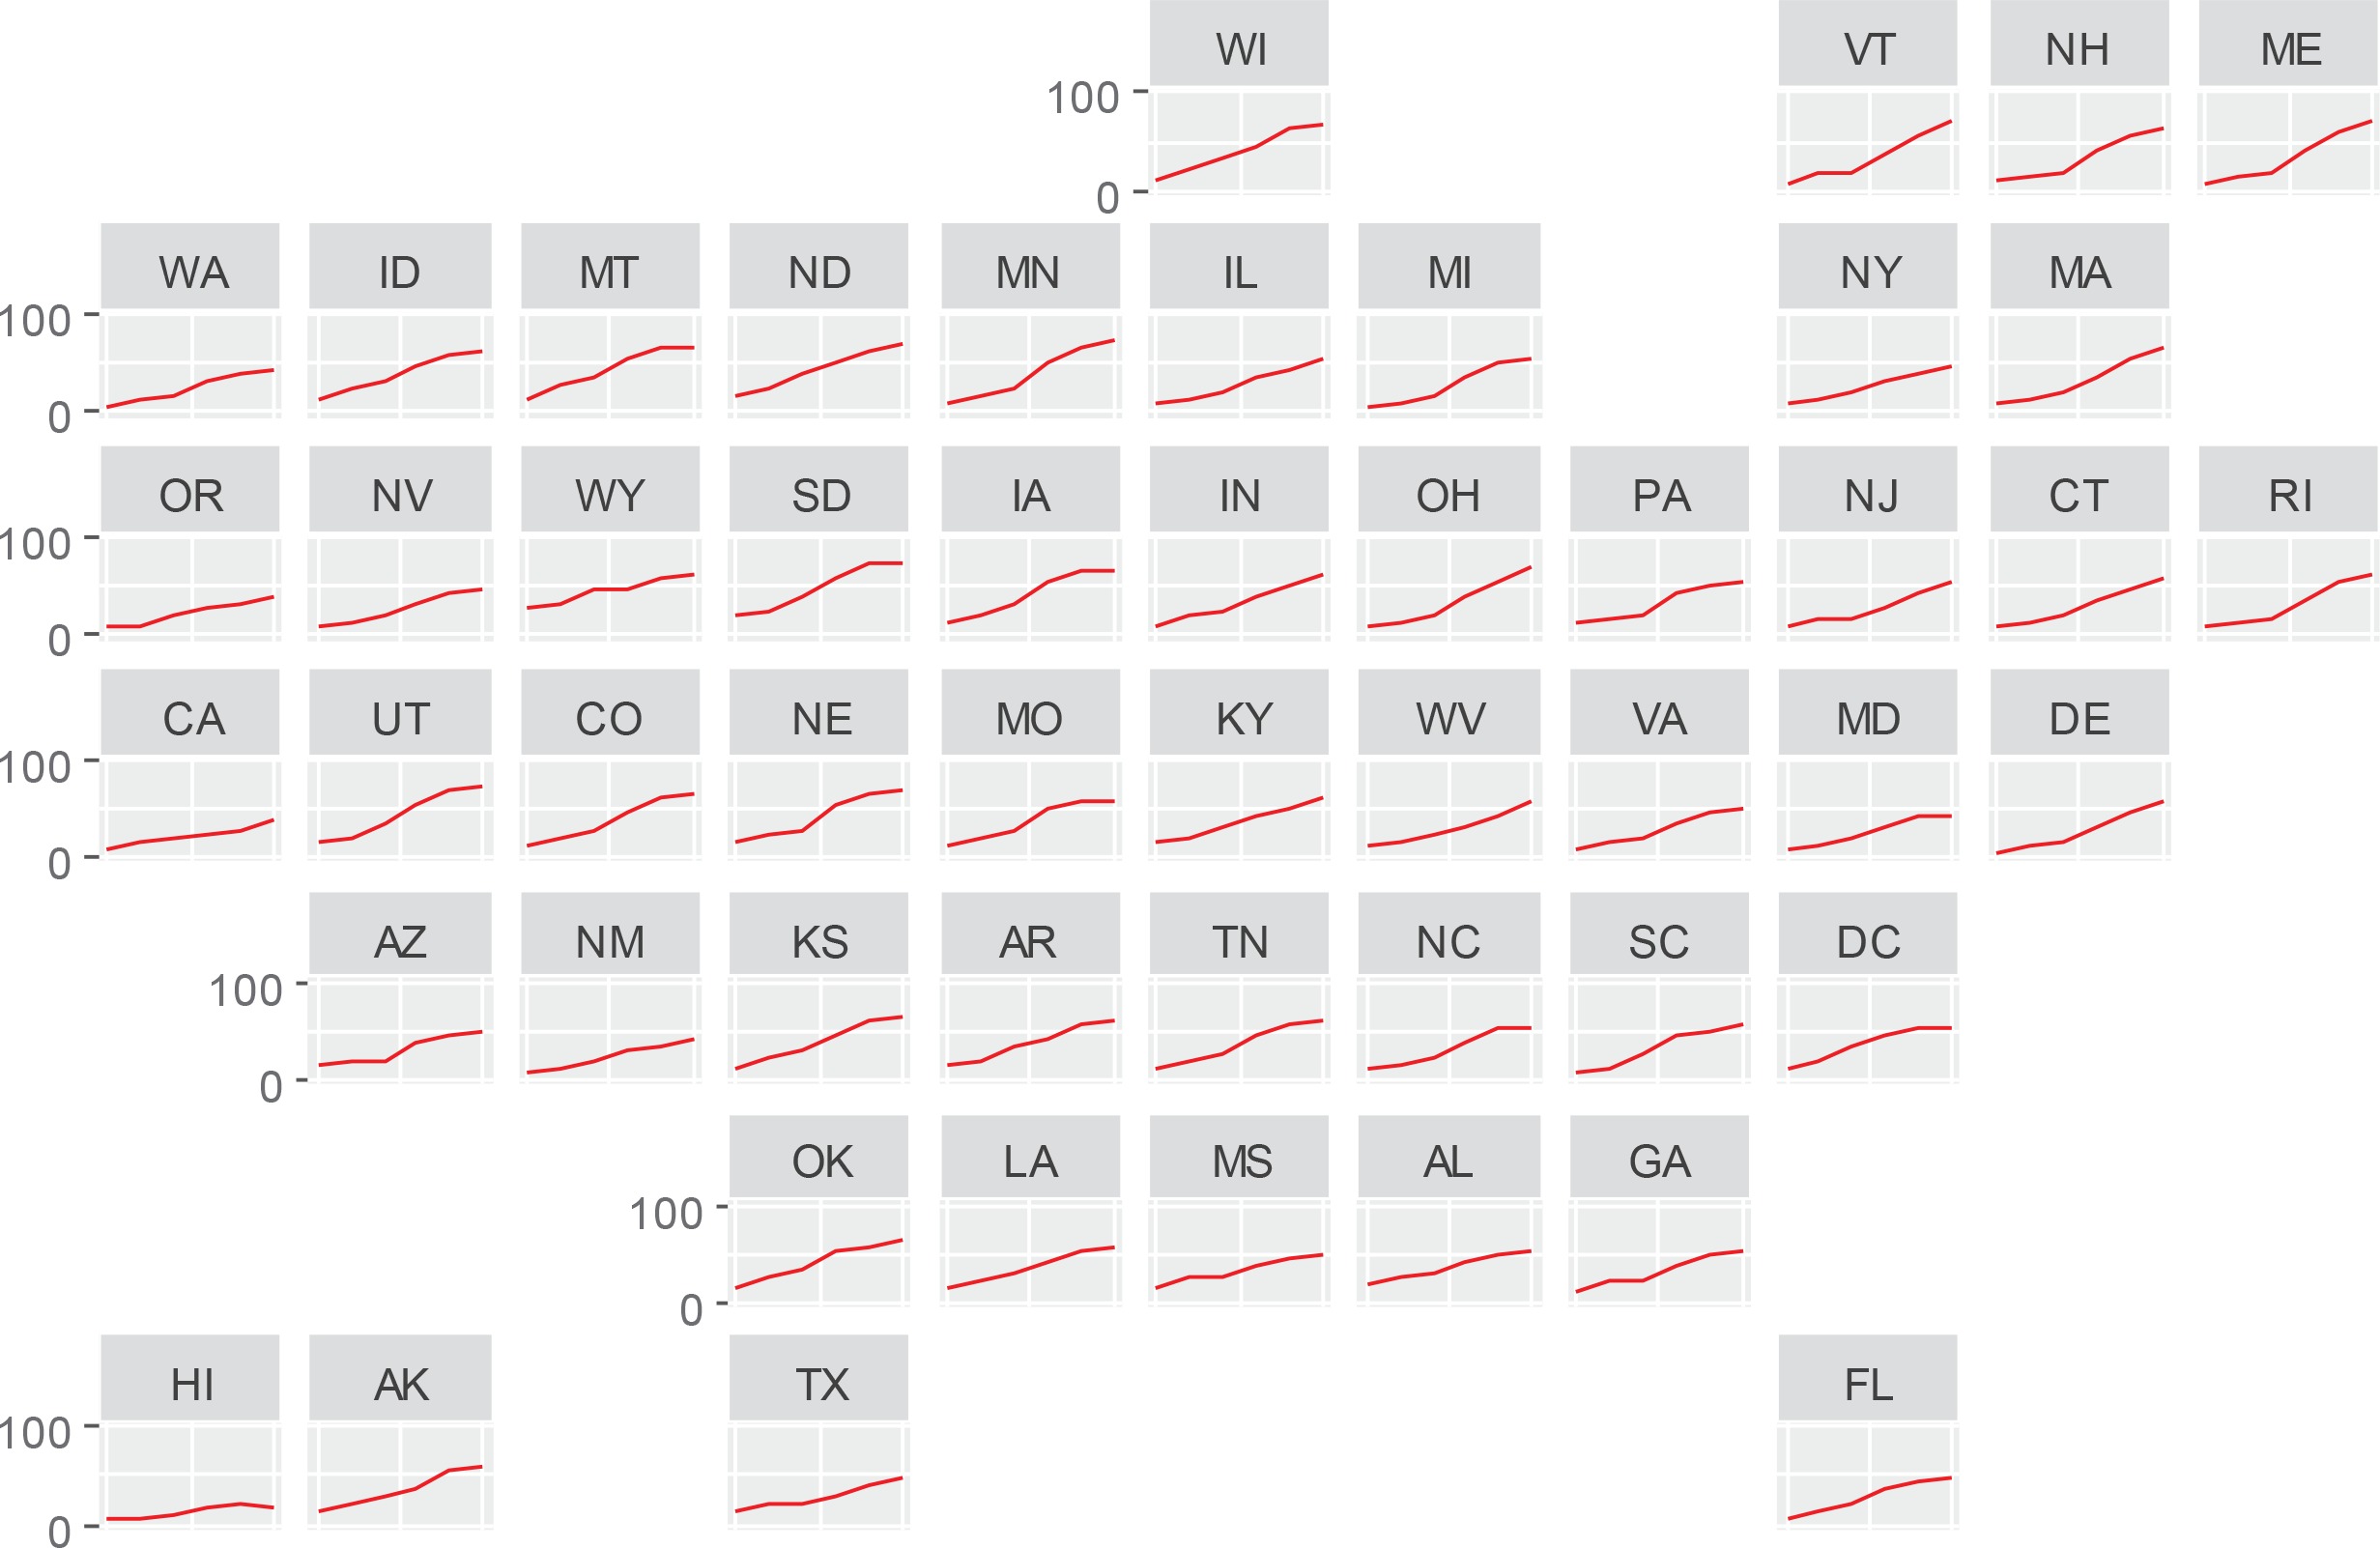
Figure 3
Increasing poor adherence to COVID-19 prevention behaviors among vaccinated US adults during survey Weeks 28–33 of the Household Pulse Survey, 14 April–5 July 2021, by occupational setting
Multivariable analysis of the most recent survey cycle spanning 23 June–5 July 2021, showed that the odds of reporting reduced adherence to public COVID-19 preventive behaviors was lower among married persons with no children in the household (adjusted odds ratio, AOR=1.21; 95% CI: 1.06–1.38) as well as married persons with a child (AOR=1.19; 95% CI: 1.04–1.37) versus single persons with no children (Table 3).
Table 3
Factors associated with suboptimal adherence to COVID-19 prevention behaviors among vaccinated US adults, Week 33 of the Household Pulse Survey, 23 June–5 July 2021 (N=57066)
| Characteristics | Categories | AOR (95% CI) | p |
|---|---|---|---|
| Household structure | Single, no children in household (Ref.) | 1 | |
| Single, ≥1 child in household | 0.81 (0.64–1.03) | 0.084 | |
| Married, no children in household | 1.21 (1.06–1.38) | 0.005 | |
| Married, ≥1 child in household | 1.19 (1.04–1.37) | 0.014 | |
| Widowed/divorced/separated, no children in household | 0.99 (0.85–1.15) | 0.901 | |
| Widowed/divorced/separated, ≥1 child in household | 0.98 (0.79–1.21) | 0.850 | |
| Unknown marital status | 0.68 (0.47–0.99) | 0.044 | |
| US census region | Northeast (Ref.) | 1 | |
| South | 1.01 (0.91–1.14) | 0.803 | |
| Midwest | 1.22 (1.08–1.38) | 0.001 | |
| West | 0.72 (0.64–0.81) | <0.001 | |
| Race/ethnicity | White, non–Hispanic (Ref.) | 1 | |
| Hispanic | 0.35 (0.31–0.40) | <0.001 | |
| Black, non-Hispanic | 0.20 (0.17–0.23) | <0.001 | |
| Asian, non-Hispanic | 0.29 (0.25–0.33) | <0.001 | |
| Gender | Male (Ref.) | 1 | |
| Female | 0.92 (0.85–0.99) | 0.035 | |
| Age (years) | 18–24 | ||
| 25–44 | 0.83 (0.66–1.04) | 0.106 | |
| 45–64 | 0.70 (0.55–0.88) | 0.003 | |
| ≥65 | 0.66 (0.52–0.85) | 0.001 | |
| Education level | < High school (Ref.) | 1 | |
| High school graduate | 1.66 (1.30–2.13) | <0.001 | |
| Some college | 2.08 (1.64–2.65) | <0.001 | |
| Associate degree | 2.14 (1.68–2.74) | <0.001 | |
| College degree | 3.42 (2.70–4.33) | <0.001 | |
| Graduate degree | 3.93 (3.10–4.98) | <0.001 | |
| Type of housing | Multi–unit apartment (Ref.) | 1 | |
| Mobile housinga | 0.85 (0.66-1.09) | 0.196 | |
| A one-family house detached from any other house | 1.23 (1.09–1.39) | 0.001 | |
| A one-family house attached to one or more houses | 1.06 (0.89–1.26) | 0.506 | |
| Unknown housing | 1.28 (1.12–1.47) | <0.001 | |
| Occupational sector | No work outside home (Ref.) | 1 | |
| Healthcare facility | 0.99 (0.88–1.12) | 0.899 | |
| Social service | 1.48 (1.20–1.83) | <0.001 | |
| Daycare/K12 | 1.26 (1.09–1.46) | 0.002 | |
| Postsecondary education | 1.42 (1.14–1.76) | 0.002 | |
| First responder | 1.64 (1.13–2.40) | 0.010 | |
| Deathcare | 2.01 (1.01–3.97) | 0.046 | |
| Correctional facility | 2.60 (1.34–5.04) | 0.005 | |
| Food/beverage retailer | 1.57 (1.19–2.08) | 0.002 | |
| Agriculture, forestry, fishing, or hunting | 2.25 (1.39–3.64) | 0.001 | |
| Any manufacturing job, food and non-food products | 1.50 (1.16–1.94) | 0.002 | |
| Postal/transportation | 0.87 (0.50–1.52) | 0.625 | |
| Other job | 1.59 (1.44–1.75) | <0.001 | |
| Ever diagnosed of COVID-19 | No (Ref.) | 1 | |
| Yes | 1.13 (1.00–1.27) | 0.051 | |
| Not sure | 0.47 (0.28–0.77) | 0.003 | |
| Unknown status | 3.30 (0.79–13.71) | 0.100 | |
| Trend in COVID-19 cases over the past 3 weeksb | Plateauing/upward (Ref.) | 1 | |
| Downward | 1.02 (0.94–1.10) | 0.652 |
b Based on data from CDC COVID-19 tracker. Daily counts of newly confirmed cases in the three weeks before the survey (i.e. cases from 1–21 June 2021), were analyzed in a linear regression model against duration (in days) to derive the coefficient measuring mean change in number of cases with each passing day. The following states saw a statistically significant downward trend in daily case counts during 1–21 June 2021: AL, CO, CT, DC, ID, IL, MA, MD, ME, MI, MN, NY, OH, PA, SD, TN, VA, VI, VT, WA, WI, and WV. All other states saw a plateauing or an increase in number of confirmed COVID-19 cases during 1–21 June 2021.
Compared to those living in the Northeast, the odds of reporting reduced adherence to NPI were higher among those living in the Midwest (AOR=1.22; 95% CI: 1.08–1.38), but lower among those in the West (AOR=0.72; 95% CI: 0.64–0.81). Compared to Whites, the odds of reporting reduced adherence was lower among Hispanics (AOR=0.35; 95% CI: 0.31–0.40), Blacks (AOR=0.20; 95% CI: 0.17–0.23), and Asians (AOR=0.29; 95% CI: 0.25–0.33). Females had lower odds of reporting reduced adherence to NPI than males (AOR=0.92; 95% CI: 0.85–0.99), as were those aged 45–64 years (AOR=0.70; 95% CI: 0.55–0.88), and those aged ≥65 years (AOR=0.66; 95% CI: 0.52–0.85), than those aged 18–24 years. The odds of reporting reduced adherence to NPI increased with increasing education (Table 3). Compared to those who lived in an apartment complex, the odds of reporting reduced adherence to NPIs were higher among those living in a one-family house detached from any other house (AOR=1.23; 95 CI: 1.09–1.39). Compared to those reporting not working outside their home, the odds of reporting reduced adherence to NPI were higher among those in social services (AOR=1.48; 95% CI: 1.20–1.83), daycare/K-12 (AOR=1.26; 95% CI: 1.09–1.46), postsecondary school (AOR=1.42; 95% CI: 1.14–1.76), first responders (AOR=1.64; 95% CI: 1.13–2.40), deathcare services (AOR=2.01; 95% CI: 1.01–3.97), correctional facilities (AOR=2.60; 95% CI: 1.34–5.04), food/beverage retailers (AOR =1.57; 95% CI: 1.19–2.08), manufacturing (AOR=1.50; 95% CI: 1.16–1.94), and agriculture, forestry, fishing or hunting (AOR=2.25; 95% CI: 1.39–3.64). Adherence to NPI was independent of past COVID-19 diagnosis and with state-specific COVID-19 trends in number of new cases in the past 3 weeks before the survey.
Comparison of various past-7-day behaviors related to COVID-19 prevention by vaccination status
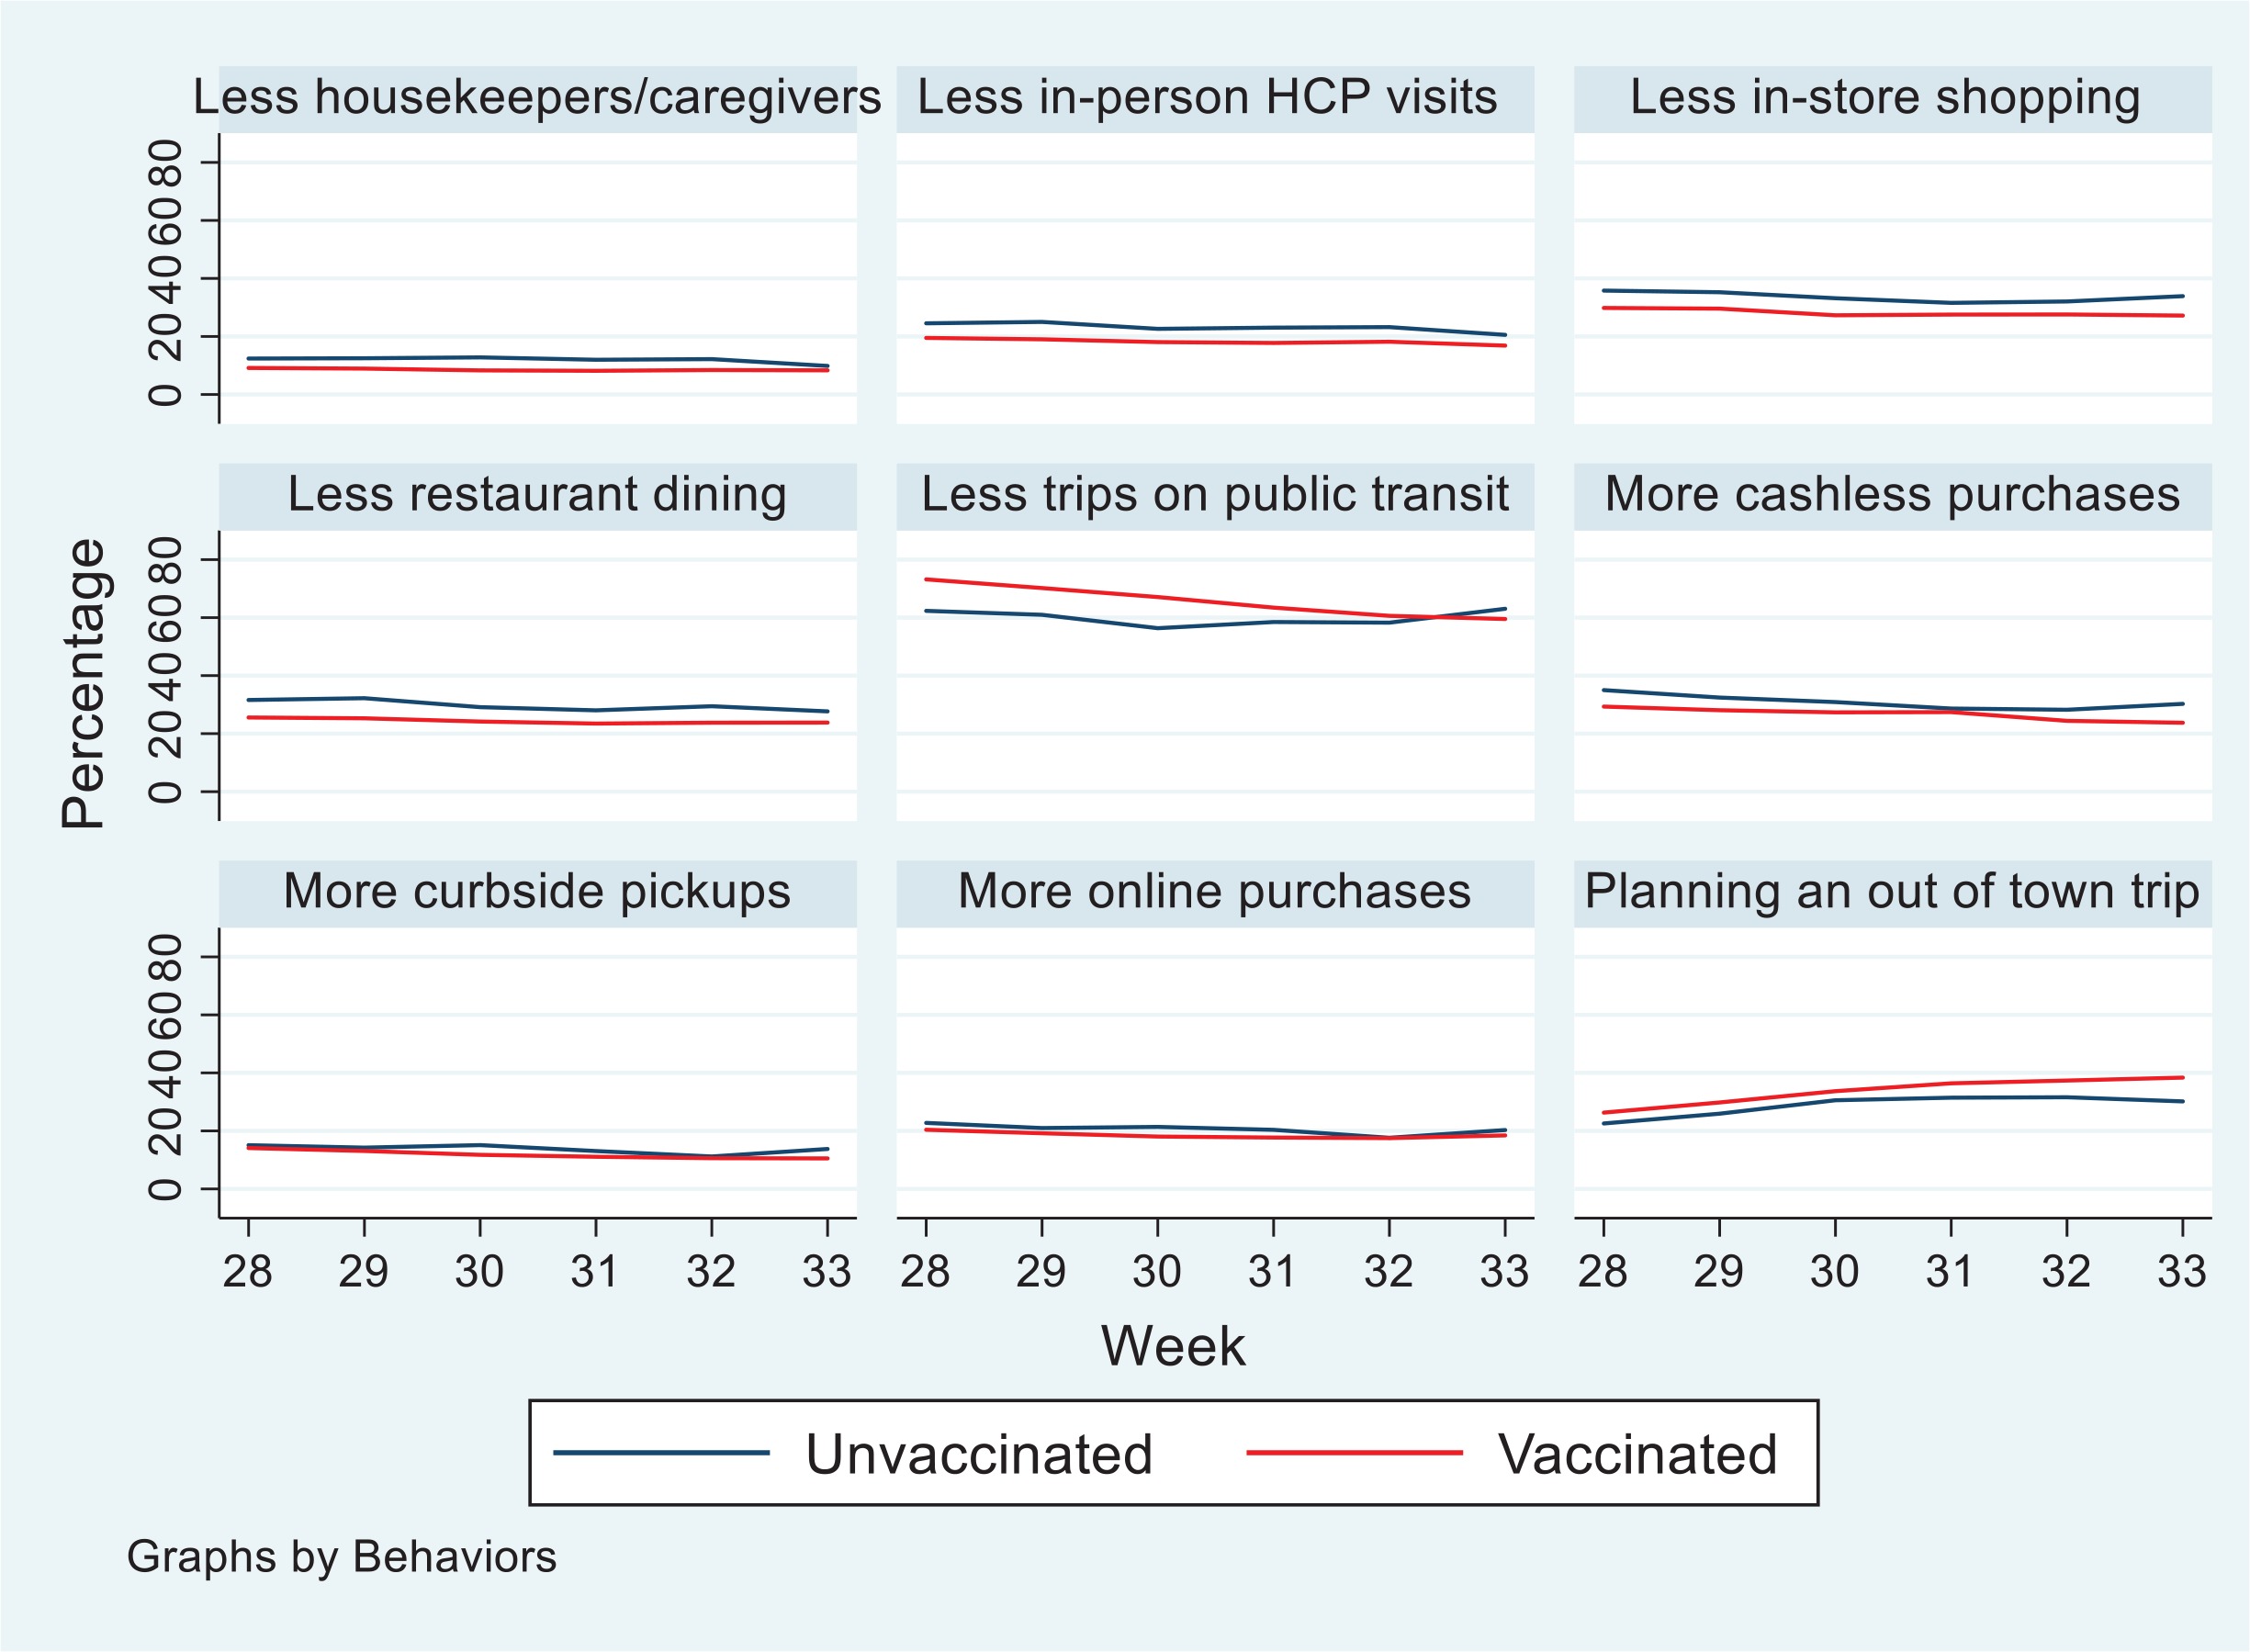
Within trend analysis over the six survey cycles spanning 14 April–5 July 2021 (i.e. survey Weeks 28–33), the results showed that increasing fewer people, both vaccinated and unvaccinated, reported past-7-day behaviors related to COVID-19 prevention (Figure 4). Overall, the percentage who reported doing more curbside shopping decreased from 14.4% to 11.1%; the percentage who reported doing more online shopping decreased from 21.1% to 18.8%; the percentage avoiding cash transactions decreased from 31.0% to 25.0%; and the percentage avoiding in-person visits to the store decreased from 31.6% to 28.4%. Similarly, the percentage avoiding dining at restaurants fell from 27.4% to 24.6%; those avoiding in-person doctor visits decreased from 21.0% to 17.5%, while those avoiding housekeeping/caregiving services decreased from 10.1% to 8.6%. Among those who typically used public transit before the pandemic, the percentage reporting reduced past-7-day use decreased from 70.0% to 60.1%, whereas the percentage of all participants who were planning an out-of-town trip in the next month increased from 25.2% to 36.8%. Of all these indicators, the trendlines over the past 6 weeks differed significantly between vaccinated and unvaccinated individuals for only three: less curbside shopping (unvaccinated: from 15.1% to 13.8%, relative percentage change, RPC= -8.7%; vaccinated: from 14.1% to 10.5%, RPC= -25.3%); less use of public transit (unvaccinated: from 62.4% to 63.1%, RPC=1.1%; vaccinated: from 73.2% to 59.6%, RPC= -18.6%); and intention to travel within the next month (unvaccinated: from 22.6% to 30.2%, RPC=33.8%; vaccinated: from 26.3% to 38.4%, RPC=45.8%).
Figure 4
Overall percentage of adults who reported past 7-day behaviors related to COVID-19 prevention, by vaccination status, 14 April–5 July 2021
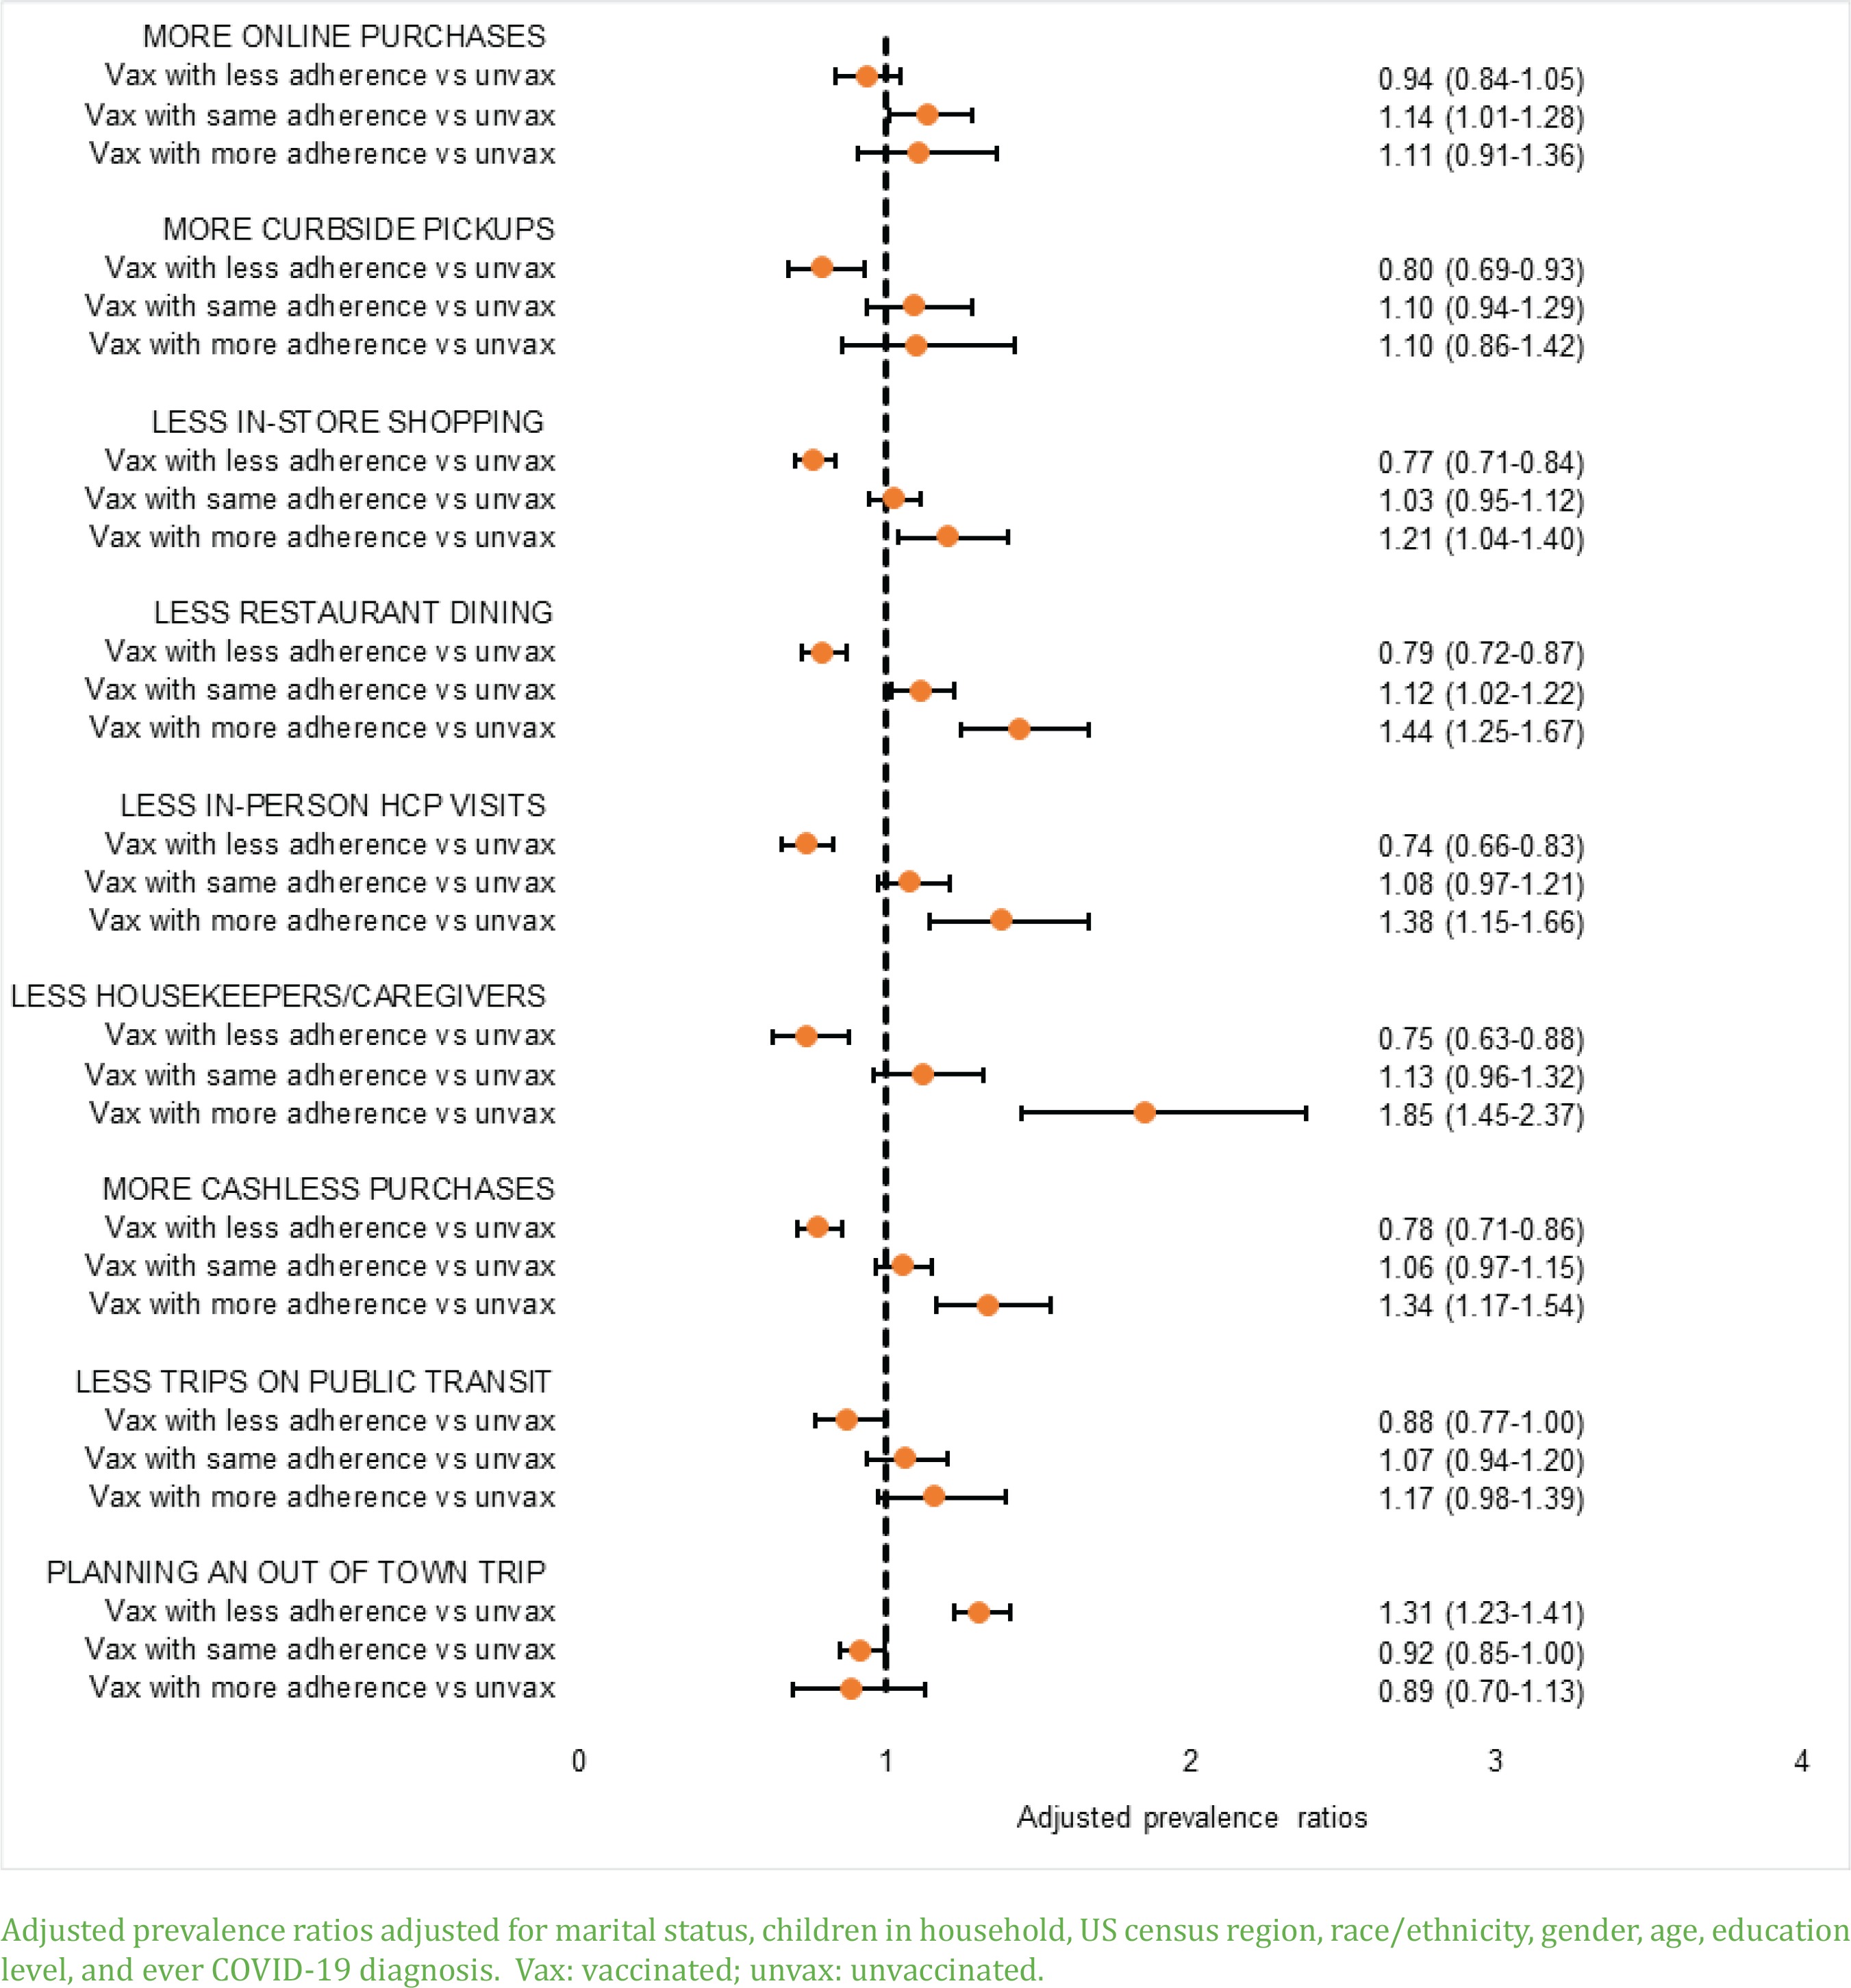
When stratifying the vaccinated by their current level of adherence to NPI relative to when vaccinated, analysis of the most recent survey cycle showed that compared to the unvaccinated, those reporting more adherence to NPI since vaccination were more likely to report avoiding the following: cash transactions (APR=1.34; 95% CI: 1.17–1.54), use of housekeeping/caregiving services (APR=1.85; 95% CI: 1.45–2.37), in-person visits to the doctor (APR=1.38; 95% CI: 1.15–1.66), dine-ins at restaurants (APR=1.44; 95% CI: 1.25–1.67), and in-store shopping (APR=1.21; 95% CI: 1.04–1.40) (Figure 5). Similarly, the vaccinated who reported maintaining the same level of prevention behaviors since their vaccination were more likely than unvaccinated individuals to report avoiding dine-ins at restaurants (APR=1.12; 95% CI: 1.02–1.22) and doing more online shopping (APR=1.14; 95% CI: 1.01–1.28). Conversely, those reporting less adherence to NPI since their vaccination, when compared to the unvaccinated, were more likely to plan to travel within the next month (APR=1.31; 95% CI: 1.23–1.41), but less likely to report using curbside shopping (APR=0.80; 95% CI: 0.69–0.93). Similarly, those reporting less adherence to NPI since their vaccination were less likely to report avoiding cash transactions (APR=0.78; 95% CI: 0.71–0.86), use of housekeeping/caregiving services (APR=0.75; 95% CI: 0.63–0.88), in-person doctor visits (APR=0.74; 95% CI: 0.66–0.83), dine-ins at restaurants (APR=0.879; 95% CI: 0.72–0.87), and in-store shopping (APR=0.77; 95% CI: 0.71-0.84).
DISCUSSION
We described trends in self-reported COVID-19 prevention behaviors among US adults and noted that during April–July 2021 and among vaccinated individuals, those with reduced adherence were more likely to be males, more educated, married, younger, living in the Midwest, and residing in a one-family house. There was a decrease in the percentage who reported avoiding public transit, in-store shopping, in-person doctor visits, dining in restaurants, or using housekeeping/caregiving services, whereas an increase occurred in the percentage who planned to travel out of town within the next month.
These findings may have implications for community spread, especially with the omicron and possibly future variants16,17,19. Intensified efforts are needed to increase vaccine coverage, including booster doses, especially for members of the population who work in settings with increased exposure risk, e.g. healthcare workers20-22. At the same time, enhanced and sustained efforts to promote adherence to NPIs in public places are needed. Federal and state-issued prevention policies are important, but voluntary preventive measures adopted by individuals and households will play an equally key role going forward, especially with the observed increasing fatigue to mandates. Intensified efforts at the state and local levels to expand capabilities for COVID-19 testing, tracing, quarantine, and isolation, may further reduce community transmission.
Limitations
This study has limitations. Not all preventive NPI behaviors were explored (e.g. mask wearing). Data were only available on whether participants had received ≥1 dose of COVID-19 vaccine, not whether they were fully vaccinated or had received a booster dose. Because of the cross-sectional nature of the data, only associations can be drawn. Finally, all measures were self-reported which could lead to misreporting.
CONCLUSIONS
During April–July 2021, there was a five-fold increase in the percentage of vaccinated adults who reported reduced adherence to public COVID-19 prevention behaviors. Those with reduced adherence to public COVID-19 prevention behaviors were more likely to be males, more educated, married, younger, living in the Midwest, and residing in a one-family house. This information may be useful for public policy makers within emergency preparedness measures for future pandemics.