
INTRODUCTION
Tobacco use is one of the most pressing public health threats worldwide, causing more than 7 million deaths annually1. Approximately 80% of the 1.3 billion tobacco users worldwide reside in low- and middle-income countries (LMICs), where the burden of tobacco-related illness and death is the heaviest1. Bangladesh – being one of the largest tobacco-consuming countries in the world – is also in a precarious position, with 37.8 million adults consuming tobacco products2.
The illicit trade in tobacco, due to its enormous extent, further compounds these challenges. The widespread availability of illicit tobacco products undermines the effectiveness of public health interventions. Globally, illicit cigarettes make up approximately 11.6% of total cigarette consumption3. Eliminating illicit trade could generate a tax revenue of $40.6 billion and save 164000 lives annually3. LMICs also face a higher prevalence of illicit cigarette trade due to weak tobacco policies, enforcement gaps, globalization and industry interference4,5.
While a higher prevalence of illicit tobacco itself can pose a challenge requiring legal interventions, the tobacco industry (TI) often promotes overestimated illicit market size to support its misleading narrative that increasing tobacco taxes leads to a surge in illicit trade. Studies have consistently exposed the tobacco industry’s efforts to overestimate the size of the illicit tobacco market to discourage tax hike6-10. Therefore, it is necessary to gauge the actual size of the illicit market for effective policy measures. As an estimation of illicit trade in tobacco often requires – at least for some methods – significant resources and efforts, countries often lack regular and accurate estimates. TIs leverage this opportunity to display a narrative to undermine anti-tax policy efforts. Therefore, it is necessary to estimate the size and dynamics of the illicit market for effective policy measures.
The estimated prevalence of illicit tobacco trade varies across regions, influenced by geographical, socioeconomic and enforcement factors. In Europe, illicit trade was reported below 7% in 18 countries, with higher rates for Ukraine, Russia, Moldova, and Belarus11. In South America, studies show industry estimates are consistently overstated. In Brazil, the illicit cigarette trade was estimated as high as 42.6% in 20166,12. In Argentina, it had stabilized at 13.7% in 20196,12,13. Chile, Colombia and Peru maintained low rates of illicit tobacco, with Colombia reporting 3.5% in 2016 and Mexico 7.6–8.8% in 20176,14. In South Africa, illicit trade spiked, peaking at 30–35% by 2017 due to weakened enforcement8. In Asia, Thailand’s illicit trade remained at 10% from 1991 to 2006, while Malaysia saw an increase to 65% by 201715,16. The Philippines maintained 16% in 2017 and India’s illicit market was 6% in 2016–2017, far below industry estimates7. It is not surprising that for many higher estimates, studies might have been funded by TIs. Hence, the need for independent data to counter inflated industry narratives is paramount.
While Bangladesh’s effort by adopting some of MPOWER (Monitor tobacco use, Protect from smoke, Offer help to quit, Warn about dangers, Enforce advertising bans, and Raise taxes on tobacco) policies are evident, there has been minimal attempt in place to counteract illicit trade17. Although Bangladesh signed the World Health Organization (WHO) Framework Convention on Tobacco Control (FCTC) protocol, it has yet to ratify the Protocol to Eliminate Illicit Trade in Tobacco Products18. Moreover, the continued involvement of tobacco industry stakeholders in policy-making raises concerns about Bangladesh’s effort to address tobacco issues10. Despite many vulnerabilities such as porous borders with India and Myanmar19, multi-tiered tobacco tax systems20 and industry interference, Bangladesh lacks a transparent and independent investigation linking the illicit tobacco market with tobacco taxation for informed policymaking. Although a recent pack analysis study reported the illicit cigarette market to be relatively low at around 5.62% in Bangladesh21, its dynamics over time and association with tobacco tax remain unexplored in the literature.
In recent years, Bangladesh has been increasing tax rates and the absolute prices of cigarettes and other tobacco products20. However, policymakers are often influenced by TI narratives, which argue that further tax increases will fuel illicit trade and ultimately reduce government revenue22. However, there is a lack of empirical evidence supporting or refuting an association between higher tobacco taxes and increased illicit trade. Since survey-based measures are costly to implement frequently, an estimation with secondary data appears to be cost-effective as well as a pragmatic alternative.
This study aims to address the knowledge gap by providing an independent estimate of the size and trend of the illicit tobacco market in Bangladesh, as well as its relationship with rising tobacco taxes, to inform evidence-based policymaking. We also examine the evolution of the illicit market size over time. Despite its limitations, the gap analysis method provides a parsimonious approach to estimate the size of the illicit market and its trend using secondary data. Uncovering the trend of illicit market share can help prioritize tobacco control measures. Furthermore, we compare the growth of the illicit market size to the growth in tax rate to contribute to the global debate of ‘tax increase leading to illicit trade’.
METHODS
Data source
In this study, we conducted a secondary analysis of cross-sectional data from the Global Adult Tobacco Survey (GATS). Two rounds of the Global Adult Tobacco Survey (GATS), conducted in 2009 and 2017, were used to estimate smoking prevalence, smoking intensity, and annual cigarette consumption in Bangladesh23,24. The analysis drew on survey questions that asked respondents about their smoking status, smoking frequency (daily or weekly), and the average number of cigarettes smoked per day or per week. A total of 12783 and 9629 individuals aged ≥15 years were interviewed in 2017 and 2009, respectively. Population estimates for this age segment were collected from the United Nations (UN) Population Division website25. The quantity of registered cigarette stick sales and tax rate data was collected from Bangladesh’s National Board of Revenue (NBR).
Registered sales figures may be subject to tobacco industries’ inventory and front-loading practices7. Furthermore, in Bangladesh, sales are recorded in terms of the July–June fiscal year, spanning between two calendar years. Thus, we took the average sales quantity of two fiscal years around the survey year. For instance, for the year 2009, we took the average cigarette sales of the fiscal years 2008–2009 and 2009–20107.
Gap analysis
To estimate the size of the illicit cigarette market, several methods, such as pack analysis, consumer surveys, gap analysis, etc., are available26. While survey-based methods require more resources, the gap analysis method is employed because of its simple and cost-effective approach. In essence, the difference between total self-reported consumption and the legal sales amount is the approximation of the tax-unpaid (illicit) cigarette market. To estimate the size of the illicit cigarette market in Bangladesh, we followed the gap analysis method similar to previous studies7-9,16,27.
The size of the illicit cigarette market share for a particular year can be computed as follows:
where, Ci is the amount of illicit cigarettes, Ccons is the estimated yearly consumption of cigarette sticks and Csale is the yearly registered (legal) sales quantity of cigarette sticks. We express Ci as a percentage of the legal market size Csale.
Yearly cigarette consumption is estimated as follows:
Here, Cigcons/year is the average number of cigarette sticks consumed per person per year. This is calculated for each year as follows:
where intensityd is the average number of cigarette sticks consumed daily by a cigarette smoker, intensityw is the average number of cigarette sticks consumed weekly by those who do not smoke daily, and n is the total number of individuals who smoke in that year26. Our analysis focuses only on manufactured cigarettes, as official records of other tobacco products were unavailable.
We expect that Ci≥0, implying estimated consumption should be equal to or higher than recorded sales. It would not be reasonable to expect cigarette sales to exceed actual consumption26. Possible explanations point toward underreporting of tobacco consumption by consumers and smuggling of cigarettes outside of the country. To adjust this, estimates of underreporting can be used and if unavailable, one can assume arbitrary levels of underreporting (e.g. 20%, 40%, 50% etc. underreporting)27. Another approach is to inflate or uplift the consumption by a factor27,28. The uplift factor for a year can be calculated by Csales / Ccons 9. Here, we assumed that underreporting is constant over time. In this work, we used the uplift factor approach for adjusting the consumption estimates to be non-negative values.
To further strengthen our analysis considering potential underreporting and/or smuggling of cigarettes, we measured the relative change in the cigarette market size over time – both legal and illicit9,12,26. Assuming all types of underreporting are constant throughout the analysis period, if the estimated consumption shows a higher rate of growth relative to the growth in legal sales, it indicates a growing size of the illicit market. To compare the relative growth, we computed the index value of Ccons(with CI bounds) and Csales as follows (for the base year, the index value would be 100):
Then, we plotted the index values for each year to show the trend and examine the relative changes in the size of the illicit market between the years.
Lastly, to observe the association between tobacco tax increase and illicit market size between 2009 and 2017, yearly cigarette consumption for the years 2010 to 2016 was linearly interpolated assuming a constant growth rate16 and official sales data from NBR were utilized.
Statistical analysis
We computed the sample statistics, namely, prevalence of smoking, prevalence of cigarette smoking and smoking intensity with 95% confidence interval (CI) using the survey weights. Along with generating point estimates for the illicit market size, we also attempt a sensitivity analysis and produce an interval estimate. First, we generated 95% CIs for the yearly average cigarette consumption per smoker through bootstrapping with 1000 repetitions. Then, we multiplied the lower CI (and upper CI) of with the lower CI (and upper CI) of the cigarette smoking prevalence rate to get the lower (and upper) bounds of total yearly cigarette consumption. Finally, we constructed a range for the illicit market size by subtracting the lower and upper cigarette consumption values from the registered sales amount . In this way, we try to capture the uncertainty around the prevalence rate and intensity of smoking cigarettes which can influence the total consumption estimate (Ccons) and consequently the illicit market size (Ci). Statistical significance was evaluated using two-sided tests with a threshold of p<0.05. Analyses were performed using MS Excel and Stata 17.
RESULTS
In the 2009 and 2017 GATS surveys, more than half of the participants were aged 21–40 years, and slightly over 50% respondents were female (Table 1). The prevalence of smoking among individuals aged ≥15 years decreased significantly between 2009 and 2017 in Bangladesh (Table 1). In 2009, the prevalence was 23% (95% CI: 21.8–24.1), which decreased to 18% (95% CI: 17–19) in 2017 (p<0.001). This represents a statistically significant 5% reduction in the proportion of smokers over the eight years.
Table 1
Estimates of cigarette consumption and illicit cigarette market in Bangladesh
| Estimates | Year | |
|---|---|---|
| 2009 | 2017 | |
| Number of observations in GATS | 9629 | 12783 |
| Age (years) (%) | ||
| 15–20 | 11.83 | 9.76 |
| 21–30 | 29.14 | 23.09 |
| 31–40 | 25.42 | 28.12 |
| 41–50 | 16.53 | 18.64 |
| 51–60 | 9.46 | 11.51 |
| ≥61 | 7.61 | 8.88 |
| Gender (%) | ||
| Male | 46.40 | 47.56 |
| Female | 53.60 | 52.44 |
| Smoking | ||
| Prevalence of smoking (%) | 23 (21.8–24.1) | 18 (17–19)*** |
| Prevalence of cigarette smoking (%) | 12.5 (11.5–13.4) | 12.6 (11.7–13.5) |
| Smoking intensity (cigarette per day) | 9.03 (8.69–9.38) | 8.96 (8.65–9.28) |
| Population (age ≥15 years) (million) | 98.9 | 113.4 |
| Registered tax-paid sales (billion sticks), Csale | 62.8 | 82.2 |
| Consumption estimates (billion sticks), Ccons | ||
| Central estimate, A | 40.6 | 46.6 |
| Estimate using 95% lower CI, B | 36.2 | 41.7 |
| Estimate using 95% upper CI, C | 45.4 | 51.6 |
| Estimated gap in tax-paid sales (%) | ||
| Central estimate, (A - Csale)/Csale | -35 | -43 |
| Estimate using 95% lower CI, (B - Csale)/Csale | -42 | -49 |
| Estimate using 95% upper CI, (C - Csale)/Csale | -28 | -37 |
| Adjusted consumption estimates using 1.80 uplift factor (billion sticks), Ccons | ||
| Central estimate, D | 73.2 | 83.9 |
| Estimate using 95% lower CI, E | 65.1 | 75.2 |
| Estimate using 95% upper CI, F | 81.7 | 93.0 |
| Estimated gap in tax-paid sales (%) | ||
| Central estimate, (D - Csale)/Csale | 16 | 2 |
| Estimate using 95% lower CI, (E - Csale)/Csale | 4 | -8 |
| Estimate using 95% upper CI, (F - Csale)/Csale | 30 | 13 |
However, the prevalence of cigarette smoking remained relatively stable over the period. In 2009, the prevalence of cigarette smoking was 12.5% (95% CI: 11.5–13.4) and in 2017, it was recorded at 12.6% (95% CI: 11.7–13.5) (Table 1). Smoking intensity, measured as cigarette consumption per day (for those who do not smoke daily, weekly consumption was converted to daily figures), also showed a slight decrease from 9.03 (95% CI: 8.69–9.38) in 2009 to 8.96 (95% CI: 8.65–9.28) in 2017. However, these marginal reductions were not statistically significant.
According to the UN Population Division, the population in Bangladesh increased from 98.9 million in 2009 to 113.4 million in 2017, an increase of 14 million (14.6% increase) (Table 1). Keeping up with the growing population, registered sales of cigarettes also increased from 62.8 billion sticks to 82.2 billion sticks (30.8% increase) in the same period.
Our central estimate shows that approximately 40.6 billion manufactured cigarette sticks were consumed in 2009 (Table 1). In 2017, this figure rose to around 46.6 billion sticks. Using the 95% CI of prevalence and smoking intensity, we computed the yearly cigarette consumption to be in the range of 36.2–45.4 billion in 2009 and 41.7–51.6 billion in 2017.
We find that, for both years, registered sales were higher than estimated consumption. This results in a negative value for the illicit market size. The share of illicit cigarettes compared to legal sales was -35% in 2009, which shrank in 2017 to -43% (Table 1). Even using the upper bound of the consumption estimate range does not result in a non-negative value of illicit market share (-28% in 2009 and -37% in 2017).
As we get Ci < 0, we calculated the uplift factors for the years 2009 and 2017 to be 1.55 and 1.76, respectively9,28. We took the larger uplift factor, rounded it up to 1.80. This would result in a larger consumption estimate, consequently providing a conservative estimate of the illicit market size.
Using this adjusted consumption estimate, we find that, compared to legal tax-paid sales of 62.8 billion sticks, the central estimate of cigarette consumption was approximately 73.2 billion sticks in 2009 (Table 1). This means approximately 10.4 billion cigarette sticks were illicit or tax-unpaid in 2009, which measures to 16% of the legal market size. In 2017, the legal sales and adjusted consumption were 82.2 billion and 83.9 billion, respectively (Table 1). This translates to 1.7 billion illicit cigarette sticks, accounting for 2% of the legal market.
From the sensitivity analysis, we find the lower bound of adjusted consumption to approximate the illicit market size to be 4% in 2009, which declined to -8% in 2017, again providing a negative value (Table 1). However, as underreporting is assumed and also evident, the upper bound of the consumption is more relevant in this context. For the upper bound, 81.7 billion sticks were approximated to be consumed compared to 62.8 billion legal sales, representing a gap of 18.9 billion cigarette sticks, representing 30% illicit market size in 2009 (Table 1). In 2017, we observed a significant reduction in this value, where illicit cigarettes accounted for 13% of the legal market (Table 1).
Figure 1 presents the result of the gap analysis in terms of the evolution of the illicit cigarette market from 2009 to 2017. Here, we look at the deviation from the original trend to infer about the growth of the illicit cigarette market12. The figure shows that, between 2009 and 2017, sales increased more quickly than consumption, implying the size of the illicit market declined between these years. The gap is also statistically significant as the trend of legal sales falls outside of the confidence interval of the estimated consumptions (Figure 1).

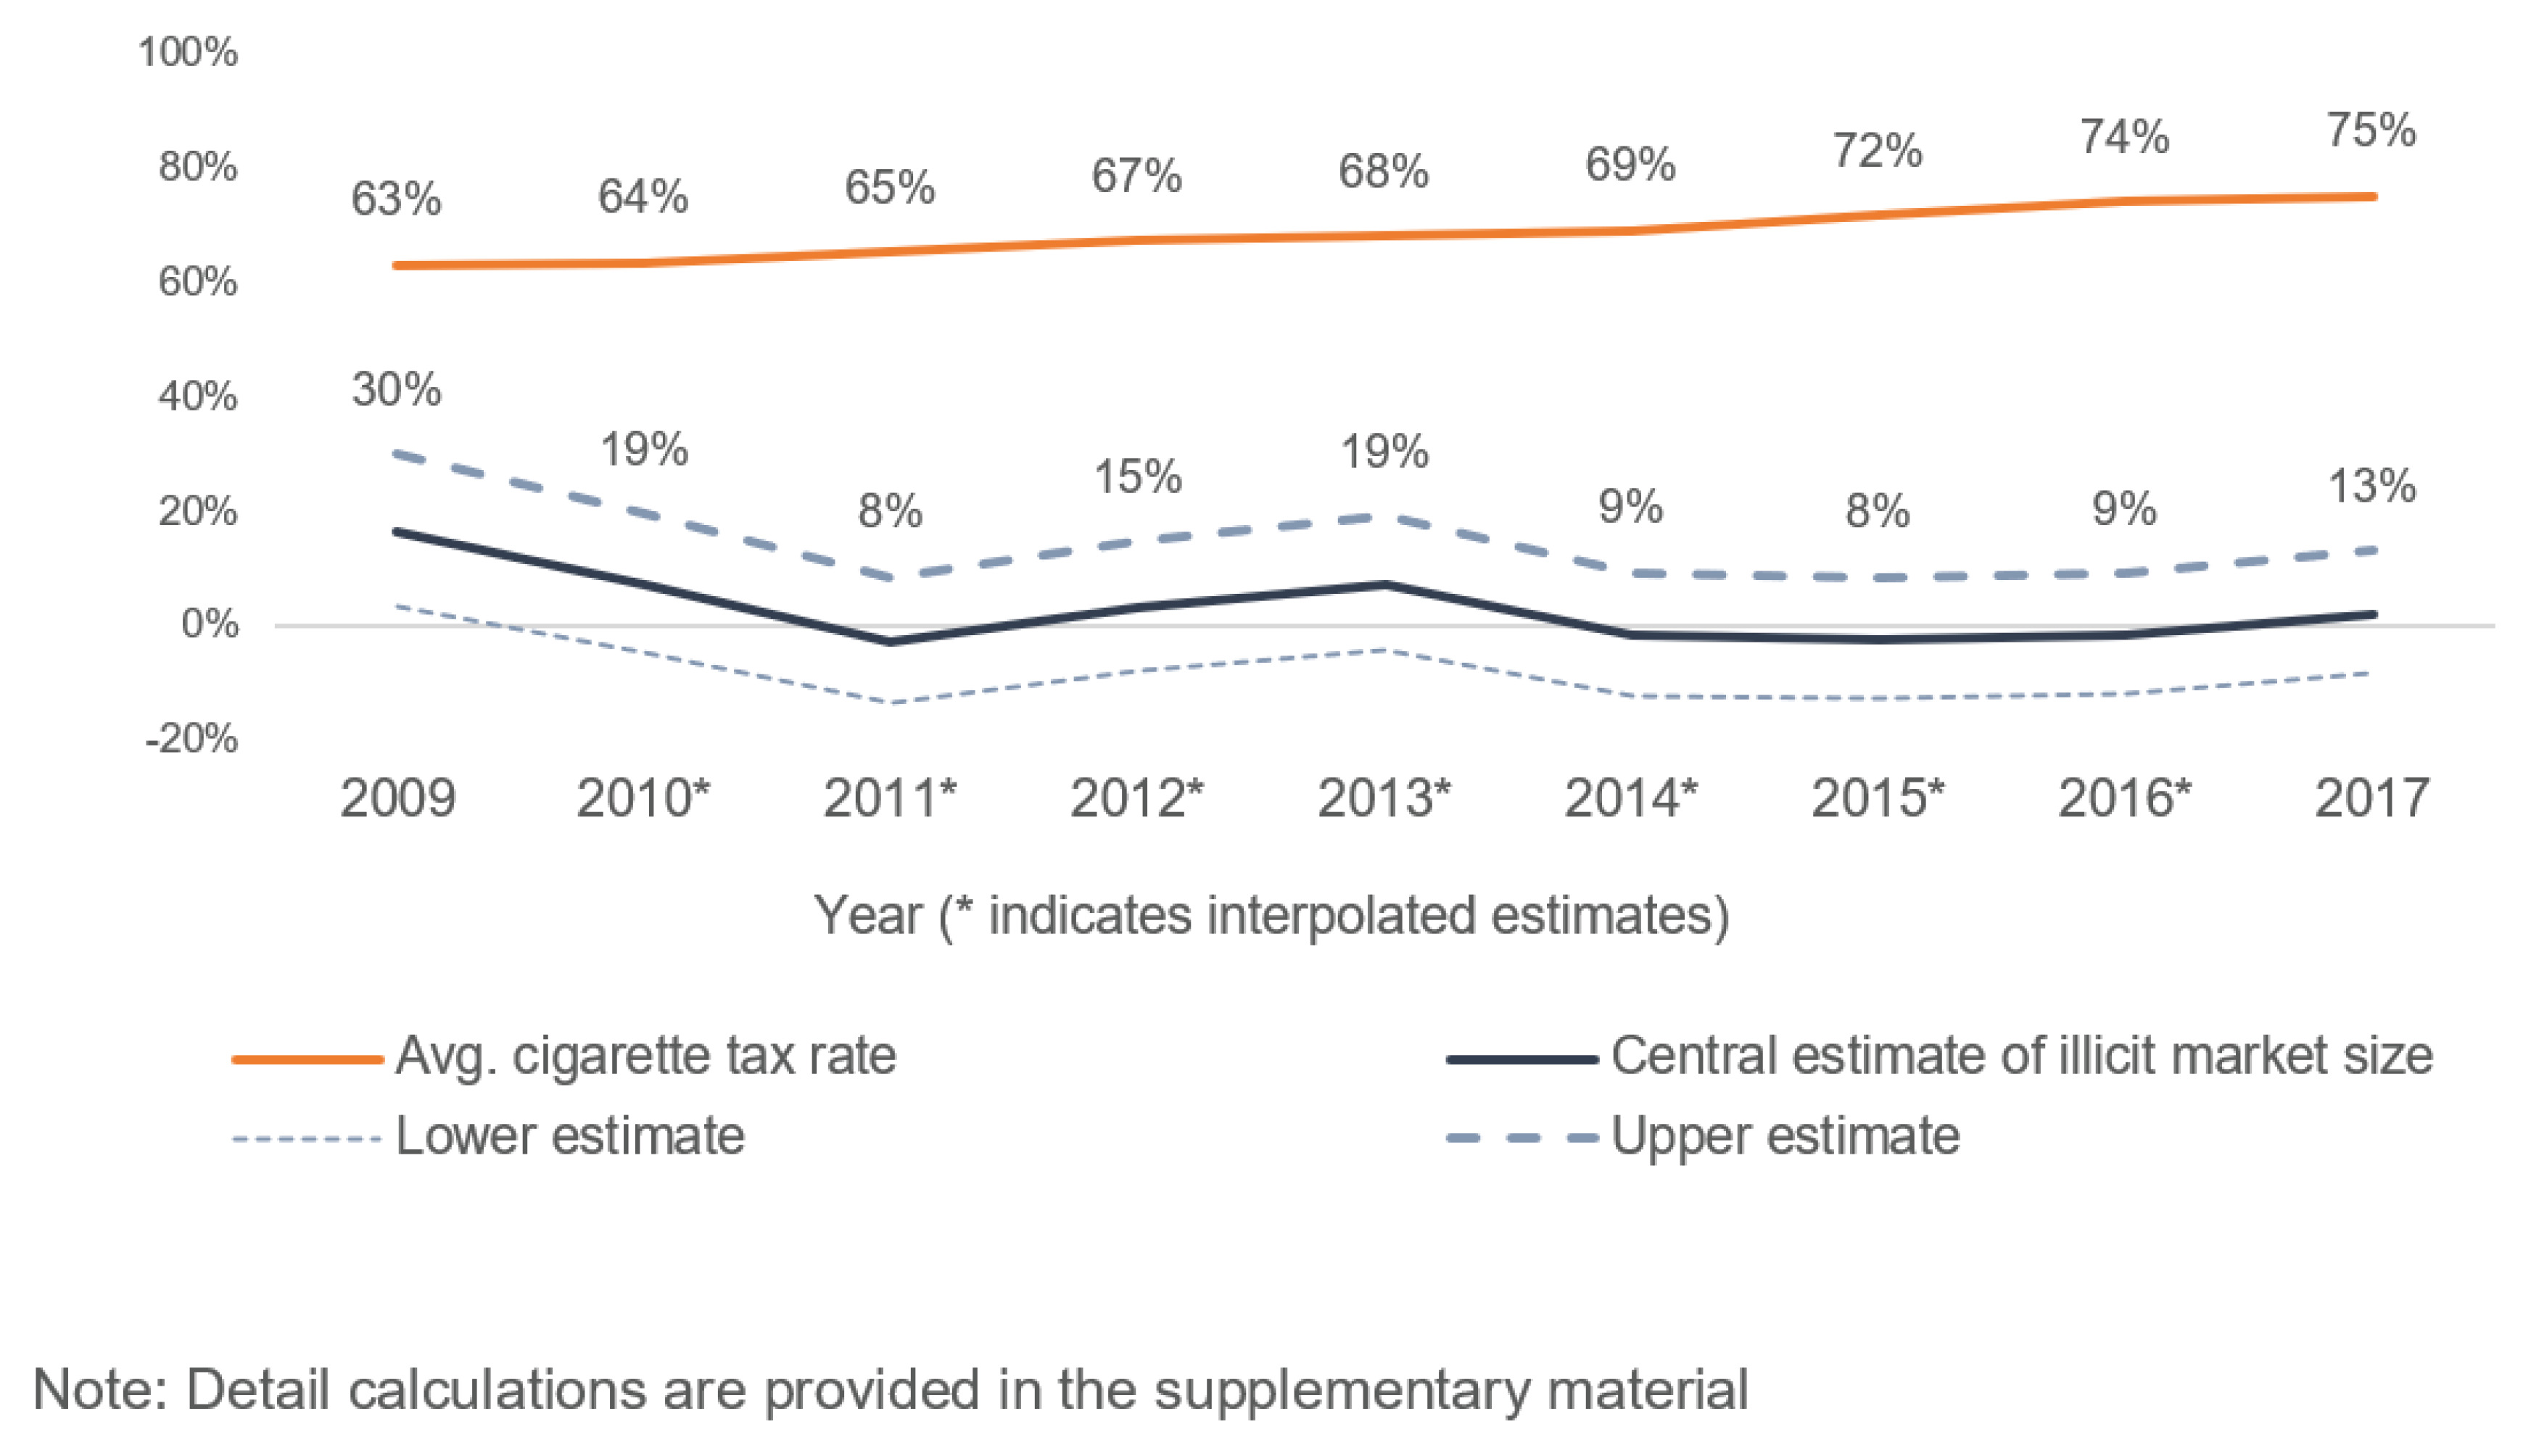
The trend of the average tax rate and illicit market size is given in Figure 2. Between 2009 and 2017, the average tax rate saw a steady increase from 63% to 75%. In contrast, the estimated illicit market size does not exhibit a significant increase. Our most conservative estimates show that compared to 2009 (31% illicit market share), the size of the illicit market had declined nearly 14 percentage points by 2017. In 2011, the illicit share decreased to 10% which then increased to 20% in 2013. Then, for the next three years, it decreased and remained at around 10%. The most recent years have seen a slight increase from 10% to 14% in 2017. Significant rise of illicit cigarettes as a response to tax increase is not evident from our findings (see Supplementary file for detailed results).
DISCUSSION
This study provides an estimate of the illicit cigarette market size and its evolution over time in Bangladesh using the gap analysis method. We find that, between 2009 and 2017, the size of the illicit cigarette market remained relatively low and declined over time despite the tax increase. The findings are in accordance with a World Bank report estimating a small illicit market share in 201729 as well as a recent estimate from a pack-analysis study reporting a similarly low level of illicit market share during 2020 in Bangladesh21. Likewise, low levels of illicit cigarette market share have been reported in independent estimates from India7, Chile30 and Georgia31. In contrast, a relatively high share of illicit cigarettes was found in Malaysia32, Brazil33 and South Africa8.
Analyzing the evolution of the illicit market reveals a decline in the illicit cigarette market share in Bangladesh. This is indicated by a faster growth rate for legal sales of cigarettes compared to reported consumption. Chile, Peru and Colombia showed similar declining trends12. Whereas Brazil12 and South Africa8 exhibited increasing levels of illicit tobacco over time.
When compared with the average cigarette tax rate, we observe the illicit cigarette market share to decline despite a sustained increase in tax. During 2009–2017, the average tax rate increased while the estimated illicit market share, although not without fluctuations, saw a decline of relatively the same proportion. Corroborating our results, the illicit cigarette market size was not associated with increasing taxes and cigarette prices in Chile, Peru, Colombia12, Vietnam27 and the Philippines9. Contrary to the tobacco industry narrative21, our findings contribute to the growing body of evidence against the positive association between tax increase and illicit tobacco.
Initially, our analysis yielded a negative illicit market size similar to the Philippines9, South Africa28 and Vietnam27. We used an uplift factor to obtain a non-negative value of the illicit market size similar to the studies in Philippines9 and South Africa8. Possible reasons for a negative illicit market size could be underreported consumption or smuggling out of the country27. However, with adjacent countries such as India reporting a low share of the illicit market7 and Myanmar considered as a source of illicit cigarettes34, underreporting is likely the reason in Bangladesh rather than smuggling out.
Interestingly, although overall tobacco smoking prevalence has decreased in Bangladesh, the prevalence and intensity of cigarette smoking have remained almost steady over time despite several rounds of tax increases. This indicates that the tax increases over time have not been substantial enough to curb cigarette consumption35. Furthermore, a multi-tiered tax system allows a smoker to switch to lower priced cigarettes in case of a price increase35,36. Also, an increase in purchasing power due to economic growth, coupled with high inflation rates, has kept the real price of cigarettes low36. Price elasticity estimates indicate that cigarettes are price inelastic in Bangladesh, which also explains the unchanged cigarette smoking prevalence rate despite price increase36.
It implies that the taxation strategy in Bangladesh may have reduced the incentive for the illicit tobacco market to expand significantly, as legal cigarettes remain affordable. Introducing illicit tobacco into the market involves legal risks, which may not be justified when the price gap between legal and illicit products is not substantial and the demand for cigarettes is inelastic37. Therefore, increases in cigarette taxes coupled with monitoring and enforcement measures (such as track and trace interventions) can reduce illicit trade while increasing tax revenue38.
Limitations
The gap analysis approach involves some strong assumptions and limitations. First, self-reported cigarette consumption may be prone to underreporting. Such data may introduce information bias (e.g. social-desirability bias) and misclassification. Also, data collected from government records may be inaccurate due to poor administrative competency in developing countries such as Bangladesh. However, we conducted sensitivity analysis and reported a range of estimates. Future research can explore underreporting rates for smoking behavior. Second, our results are based on some assumptions, such as a constant rate of underreporting over time26. Another assumption was that smoking prevalence and smoking intensity among individuals aged <15 years remained unchanged over time, as this population was not covered by the GATS survey; however, it is a relatively small share of the population and unlikely to substantially affect the consumption estimates12. Third, interpreting the negative value of the illicit market size can be challenging. Although literature suggests underreporting of consumption and smuggling out to be one of the potential explanations27, confirming the exact reason is beyond the scope of this study. Fourth, having only two consumption data points for 2009 and 2017, we linearly interpolated the consumption data, assuming a constant growth rate when comparing with tax rates. This may overlook actual fluctuations in consumption during that time. We address this by examining the relative growth of legal sales and consumption over time. While this method does not give us the exact size, it is sufficient to infer about the growth of the illicit market size, assuming all types of underreporting are constant over that period26. Furthermore, we do not identify the sources of illicit cigarettes, their drivers or the associated losses in tax revenue. In addition, potential confounding factors were not explicitly accounted for. These limitations highlight important areas for future research. While the findings primarily reflect the context of Bangladesh and may not be directly generalizable to other settings, they contribute to the growing body of evidence on illicit tobacco and taxation.
CONCLUSIONS
Based on our findings, we can say that despite tax increases, illicit cigarettes are not an alarming issue for Bangladesh. Between 2009 and 2017, the size of the illicit market remained relatively low and saw a gradual decline. These results suggest that concerns about a substantial expansion of illicit trade following tax increases may be overstated in the context of Bangladesh. Policymakers should not be disinclined to increase tobacco taxes, anticipating an influx of illicit cigarettes. However, surveillance capacity for tracking illicit cigarettes should be appraised and enhanced regardless. Future research could build on this work by using alternative data sources, incorporating supply-side information and addressing potential confounding factors. Further studies that explore the dynamics of illicit trade, enforcement practices, and behavioral responses to tax changes would help provide a more comprehensive and robust evidence base.