
INTRODUCTION
The COVID-19 pandemic was a shock to the healthcare system in the US and around the world as it revealed gaps in preparedness and response measures1. Despite ranking first out of 195 countries (Global Health Security Index, 2019)2 in the 2019 Global Pandemic Response, the US struggled initially in responding to the pandemic and ranks as one of the 20 countries most impacted by COVID-19 fatalities (Johns Hopkins University, 2020)3.
Healthcare providers (HCP) have played a key role in caring for COVID-19 patients, and this has placed an enormous strain on the healthcare workforce4-6. Nurses are one of the most significantly impacted groups of healthcare workers due to their direct involvement in the day-to-day care of COVID-19 patients7,8. However, to date, there is limited information on the macroenvironmental factors related to the nursing profession that may have impacted COVID-19 outcomes in the US. One framework to examine macroenvironmental influences is PESTEL analysis (Political, Economic, Social, Technological, Environmental and Legal)9. Within this framework, political factors are those concerning governments and government policies. Economic factors are those related to economic demand and supply (e.g. the nursing workforce). Social factors are those related to demographic and social factors (e.g. the racial distribution of the nursing workforce and how this distribution influences the ability to mount a culturally appropriate response during COVID-19). Technological factors are those that involve innovation and production levels (e.g. the use of telemedicine during COVID-19). Environmental factors can include the wide range of healthcare facilities in which nurses’ work and how the physical and contextual differences in these facilities modify the risk of being exposed or exposing others.
Legal factors include recent government mandates requiring the vaccination of healthcare personnel. Within this framework, it is important to identify lessons learned from the pandemic upon which key preparedness activities for future responses can be based. In this study, we sought to examine the degree of preparedness of the US nursing workforce (national and state-specific) prior to COVID-19, by examining three specific elements of the PESTEL framework: the size and specialization of the pre-COVID-19 nursing workforce (economic element); the racial composition of the pre-COVID-19 workforce (social element); and baseline experience with telehealth applications (technological element). The objective of the study was to measure the correlation between the number of state-specific COVID-19 hospitalizations per nurse and COVID-19 deaths and assessed factors associated with nurses reporting an intention to leave their current jobs from stressors like those associated with COVID-19, including stress and burnout. Specific research questions were: 1) ‘Nationally and by state, what was the distribution of nurses in 2018 in terms of race/ethnicity, and how did this compare to the underlying race/ethnic distribution of the underlying population?’; 2) ‘What was the size of the nursing workforce nationally and in each US State during 2018 (baseline) and is there a correlation between the state-specific number of nurses per COVID-19 hospitalization and COVID-19 deaths?’; 3) What percentage of nurses reported having experience with telehealth applications in 2018 nationally and by state, and how was this associated with the deployment of telehealth during the COVID-19 pandemic across states?’; and 4) What percentage of nurses report an intention to leave their jobs from stressors similar to those associated with COVID-19, including stress and burnout, and what implications might this have for the future workforce?’.
METHODS
Data source and measures
Within this secondary dataset analysis, multiple publicly available de-identified datasets were combined to explore the research questions. These datasets included the 2018 National Sample Survey of Registered Nurses10, the CDC COVID Data Tracker11, the Household Pulse Survey, the 2018 Behavioral Risk Factor Surveillance System and the 2018 National Health and Information Survey (NHIS).
The 2018 National Sample Survey of Registered Nurses
The 2018 National Sample Survey of Registered Nurses (NSSRN) (US Department of Health and Human Services, Health Resources and Services Administration, 2019) was a nationally representative survey of individuals with an active RN license conducted from April 2018 to October 2018 and administered via a web instrument or a paper questionnaire (n=50273, response rate=50.1%). Across states, data were collected on the number of nurses (licensed and active), primary nursing employment (e.g. work setting, involvement in patient care, specialty), current and past nursing positions, reasons for leaving past positions or intentions to leave current position, and utilization of telehealth (at the level of the ‘workplace’ and ‘personally’).
CDC COVID Data Tracker (Centers for Disease Control and Prevention, 2021)
For each US State, we obtained counts of total COVID-19 hospitalizations and deaths, from the start of the pandemic up to 24 September 2021.
Household Pulse Survey
The Household Pulse Survey is an ongoing weekly, cross-sectional, COVID-19-specific survey of the US adult population conducted across US states since 23 April 2020. We used it to assess the utilization of telehealth by adults (self-reported by adults in households) and by children (proxy-reported by adults in households with children). State-specific utilization of telehealth (assessed during 14–26 April 2021) was defined as having ‘had an appointment with a doctor, nurse, or other health professional by video or by phone in the last 4 weeks’.
National and state-specific data on race/ethnic composition of the adult population
We analyzed the 2018 Behavioral Risk Factor Surveillance System (BRFSS) to determine state-specific racial/ethnic distributions of adults (non-Hispanic White, non-Hispanic Black, non-Hispanic Asian, non-Hispanic other, and Hispanic). Because BRFSS is only designed to yield state-specific estimates (not national), we used the 2018 NHIS, an annual, nationally representative, in-person survey of the noninstitutionalized US population, to estimate the race/ethnic distributions of the overall US population.
Statistical analysis
Data from the different surveys were weighted to yield representative estimates. We described the size of the employed nursing workforce in multiple ways: as an absolute count of registered nurses, as a ratio of how many nurses served 1000 individuals in the total population, and as a ratio describing the number of employed nurses per COVID-19 hospitalized case. We estimated the number of employed nurses in each state by multiplying the number of licensed/active nurses by the percentage employed. Across states, we calculated the correlation between the ratio of the number of employed nurses per COVID-19 hospitalization case and the number of COVID-19 deaths per 100000 population. We also estimated the correlation between the percentage of nurses in each state who reported that telehealth applications were used in their workplace at baseline, and the percentage of respondents across states who utilized telehealth during COVID-19. For more nuanced descriptive analysis, we calculated the percentage of all employed nurses in a state using telehealth (i.e. denominator comprising all employed nurses) by multiplying the probability that a nurse’s facility was telehealth-enabled against the probability that they personally used telehealth conditional on their facility being telehealth-enabled.
We assessed reasons for switching their primary jobs among those who switched in the past year, as well as reasons for considering switching among those who did not switch but considered doing so. Given the dire work situations imposed by COVID-19 in some places, including staff shortages, illness, and deaths among nursing staff, as well as longer and more strenuous work hours12,13, we were interested in factors associated with people considering leaving their nursing jobs because of burnout, insufficient staffing, challenging patient population, inconvenient work schedules, and stressful work environment.
We calculated adjusted prevalence ratios (APRs) in a multivariable Poisson regression model that assessed for correlates of these outcomes. The independent variables assessed were gender, marital/parenthood status, years of nursing practice, years at the current job, annual personal income, US census region, race/ethnicity, employment type, and area of speciality. All analyses were performed in Stata V14. Statistical tests were two-tailed, and statistical significance was assessed at p<0.05.
RESULTS
Sociodemographic and professional characteristics of the nursing workforce in the US
Of licensed nurses nationwide, 82.7% were employed. Overall, 90.0% of employed nurses were female. By marital status, 70.9% were married, 15.3% were widowed/divorced/separated, and 13.8% were single, never married. Furthermore, 44.2% had ≥ one child. The mean age was 46.5 years; only 4.9% were foreign-trained.
A comparison of the racial distribution of nurses nationally and in each state (compared to the underlying racial distributions of adults) showed striking underrepresentation of racial minorities, particularly Blacks and Hispanics (Table 1). Nationally, 11.7% of the US adult population in 2018 was non-Hispanic black with 7.8% of licensed nurses, and 16.3% of the population was Hispanic with 10.2% of licensed nurses. In contrast, 63.1% of the overall population was White with 73.3% of licensed nurses. Under-representation of Blacks was most striking in Alabama (25.6% of population Black with 15.3% of licensed nurses, a gap of 10.3 percentage points); Louisiana (30.6% of population Black with 13.6% of licensed nurses, a gap of 17.0 percentage points); Mississippi (35.7% of population Black with 16.5% of licensed nurses, a gap of 19.2 percentage points); and South Carolina (25.4% of population Black with 9.6% of licensed nurses, a gap of 15.8 percentage points).
Table 1
Comparison of the race/ethnic distribution of licensed nurses versus the general adult population, nationally and by US State, 2018
[i] The 2018 National Sample Survey of Registered Nurses (n=50273) was analyzed to determine race/ethnic distributions of nurses. All registered nurses were analyzed regardless of whether they were currently employed. The 2018 Behavioral Risk Factor Surveillance System (n=437436) was analyzed to determine race/ethnic distributions of the general adult population aged ≥18 years by state. The 2018 National Health Information Survey (n=25417) was analyzed to determine race/ethnic distributions of the general adult population aged ≥18 years in the US overall. All three surveys were weighted to yield representative estimates. Race/ethnic categories are mutually exclusive. Data not available for some states in the 2018 National Sample Survey of Registered Nurses.
Of employed nurses, 62.9% reported practicing for over a decade since their first nursing training. However, 47.5% had <5 years in their current job. In terms of the type of clinical speciality where they spent most of their patient care time, only 0.6% reported infectious/communicable disease, and 0.9% reported pulmonary/respiratory. The most common areas of practice were general medical surgical (19.7%), ambulatory care (10.6%), and chronic care (9.9%) (Supplemental file Figure 1). Respondents reported being scheduled at work for 34.9 hours/week on average but actually working 37.5 hours/week on average. Of this work time, 56.4% was spent on patient care and charting, 11.3% on care coordination, 14.4% on management/supervision/administrative tasks, 2.3% on research, 7.2% on teaching/precepting/orienting students or new hires, 4.7% on non-nursing tasks (e.g. housekeeping, locating supplies), and 3.7% on other tasks not specified. Overall, 83.4% of registered nurses indicated they saw patients. Regarding the age distribution of patients seen, 2.8% were pre-natal patients, 6.6% neonatal/newborn/infants <2 years, 6.3% pediatric patients aged 2–11 years, 6.0% adolescents aged 12–17 years, 42.0% adults 18–65 years, and 36.2% patients aged >65 years.
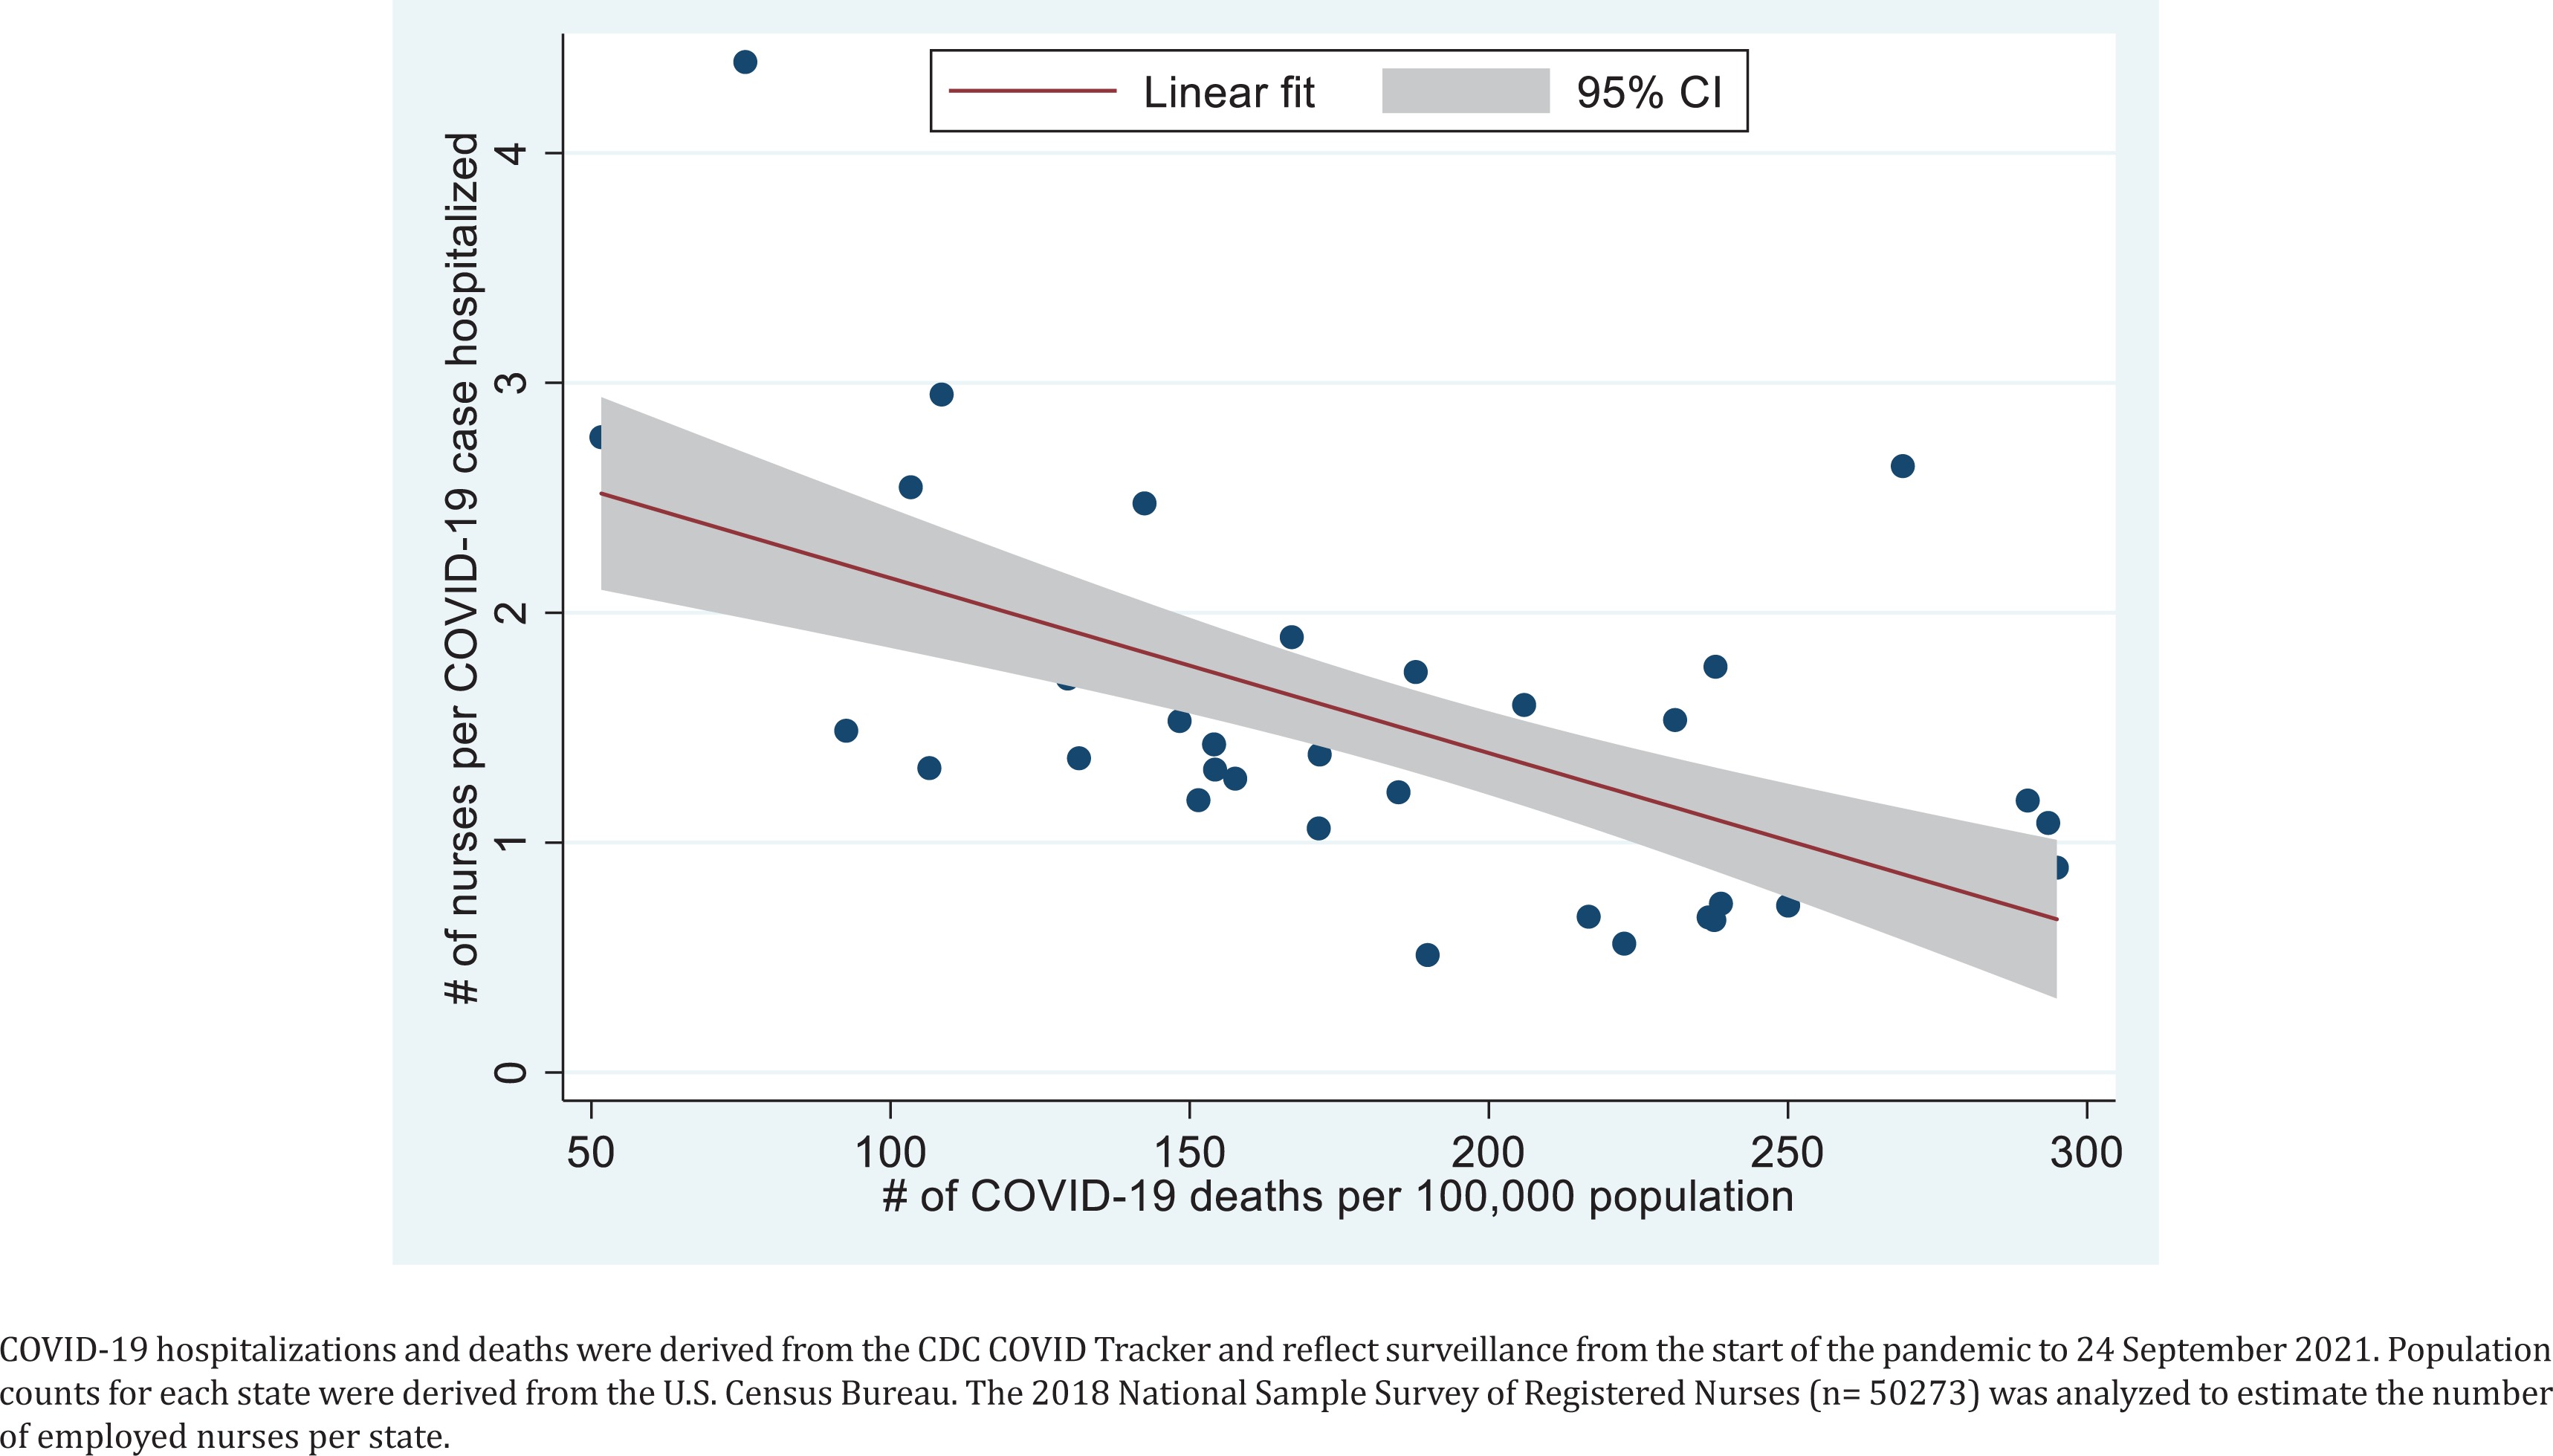
Figure 1
Correlation between number of nurses per COVID-19 case hospitalized (cumulative) and number of COVID-19 deaths across US States, 2021
Of all employed nurses, most had skill-based certifications in life support (73.6%), and resuscitation (49.0%), but only 6.1% had certifications in critical care. Participants reported that additional training in the following topics would help them do their job better: evidence-based care, 39.0%; patient-centered care, 39.8%; team-based care, 30.4%; value-based care, 14.8%; practice management and administration, 18.6%; and social determinants of health, 18.5%. Other areas where training was desired included caring for medically complex/special needs patients, 29.0%; mental health, 24.8%; quality improvement, 28.2%; and population-based health, 14.3%. Only 13.6% reported they did not need any additional training.
Correlation between variations in the size of the nursing workforce pre-COVID-19 and COVID-19 mortality
The absolute counts of employed nurses in each state are shown in Table 2. The five states with the lowest number of employed nurses per 1000 population were South Carolina (6.3), California (7.5), Texas (7.9), Nevada (8.3), and Arizona (8.5). The five highest were Ohio (13.0), Minnesota (13.3), Massachusetts (13.5), Delaware (14.2), and Washington D.C (17.8). Over the entire course of the pandemic, on average, each nurse in the following 11 states saw more than one COVID-19 hospitalized case: Kentucky, Oklahoma, Georgia, South Carolina, Texas, Florida, Alabama, Nevada, Arkansas, Arizona, and Louisiana. Kentucky was the hardest hit with a ratio of 0.5 or 1 nurse to 2 COVID-19 hospitalized cases. In contrast, there were between 2 to over 4 fresh graduate nurses for every COVID-19 case hospitalized in the following eight states: Minnesota, Oregon, Alaska, Washington, Massachusetts, Hawaii, New Hampshire, and Maine. As the number of nurses to take care of each COVID-19 case increased, the number of COVID-19 deaths per 100000 population decreased (ρ= -0.6454, p<0.001). This strong inverse correlation is shown in Figure 1.
Table 2
Number of employed registered nurses, telehealth experience of employed nurses, and burden of COVID-19 hospitalizations and death by US State, 2018
[i] The 2018 National Sample Survey of Registered Nurses (n=50273) was analyzed to determine employment status of registered nurses. Population counts for each state were derived from the US Census Bureau. Total number of employed nurses (including self-employed) was estimated by multiplying the estimated total number of registered nurses in each state by the percentage employed. Counts of COVID-19 hospitalization and death were derived from the CDC COVID Tracker and reflect surveillance from the start of the pandemic to 24 September 2021. Percentage of all employed nurses in the state using telehealth was derived by multiplying the probability that a nurse’s facility was telehealth-enabled by the probability that they personally used telehealth conditional on their facility being telehealth-enabled. All survey data were weighted to yield representative estimates. Data not available for some States in the 2018 National Sample Survey of Registered Nurses.
Association between telehealth utilization baseline and uptake of telehealth during COVID-19
Overall, 32.9% of nurses at baseline indicated that their facility utilized telehealth services, and of these, 50.4% indicated that they personally used telehealth services. The effective prevalence of use of telehealth services among all employed nurses was 16.6% nationally, ranging from 10.0% in Iowa to 22.9% in California.
The dominant use of telehealth services prior to COVID-19 was not for direct patient communication but rather for communication between providers (54.4% of those reporting their facilities were telehealth-enabled, ranging from 40.9% in Iowa to 72.4% in South Carolina) (Supplementary file Table 1). The second most frequent application of telehealth was to call patients on their phones (49.2%, ranging from 36.2% in South Carolina to 70.2% in Maryland). Only 4.5% of nurses reporting use of telehealth indicated they used it for e-Visits, while 2.2% reported using it for other purposes not otherwise specified.
During April 2021, 24% of adults reported that a child in their household had an appointment with a doctor, nurse, or other health professional by video or by phone in the last 4 weeks (ranging from 6.3% in Wyoming to 35.6% in D.C). During that same period, 25.7% of adults reported they had an appointment with a doctor, nurse, or other health professional by video or by phone in the last 4 weeks (ranging from 13.4% in Nebraska to 37.0% in D.C). Across states, there was no significant association between the nurse-reported extent of telehealth adoption before COVID-19 and the utilization of telehealth during COVID-19 either among pediatric (p=0.3861) or adult respondents in the population (p=0.9222).
Reasons for leaving or considering leaving occupied primary nursing position
Of all nurses currently employed, 12.8% (range: 12.2–13.5) had switched their primary nursing position in the past year (n=5429), 47.6% (range: 46.6–48.6) ever considered leaving the position they occupied in the past 12 months but did not leave (n=20682), while 39.6% (range: 38.6–40.6) had neither switched nor considered leaving in the past year (n=17849). Job-related triggers for those who ever switched as well as those who ever considered switching included the type of patients they saw (6.8% and 9.0%, switched and considered, respectively), physical demands of the job (10.9% and 17.5%), scheduling/inconvenient hours (18.2% and 19.5%), stressful work environment (34.4% and 41.6%), inadequate staffing (30.0% and 42.6%), and burnout (31.5% and 43.3%) (Supplemental file Figure 2).
The likelihood of considering leaving the current position because of burnout was higher among single nurses without children than married ones with children (APR=1.20; 95% CI: 1.08–1.33) (Table 3). Conversely, the likelihood decreased with increasing years of practice, and was lower among those self-employed than traveling nurses employed by an agency (APR=0.52; 95% CI: 0.31–0.88). Intention to quit current nursing job because of inconvenient scheduling, when compared to married persons with a child, was lower among single individuals without children (APR=0.78; 95% CI: 0.63–0.96), married individuals without children (APR=0.82; 95% CI: 0.71–0.94), and those widowed, divorced, or separated with children (APR=0.71; 95% CI: 0.52–0.95), but higher among those never married but with children (APR=1.50; 95% CI: 1.12–2.01). Compared to married persons with children, intention to quit the current job because of the physical demands of the job was higher among those married without children (APR=1.36; 95% CI: 1.16–1.60). Non-Hispanic Asians were more likely than Whites to intend to quit because of the physical demand of the job (APR=1.52; 95% CI: 1.18–1.97) or the patient population (APR=1.82; 95% CI: 1.28–2.58). While those at the highest two income categories were more likely than those earning <$35000 to quit because of burnout, they were less likely to intend to quit because of the physical demands of the job, or a stressful work environment. Those working in a long-term care facility (e.g. nursing home) were less likely than those working in a hospital to intend to quit because of burnout (APR=0.76; 95% CI: 0.68–0.84), the patient population (APR=0.71; 95% CI: 0.53–0.95), physical demands of the job (APR=0.30; 95% CI: 0.23–0.38) and inconvenient schedules (APR=0.80; 95% CI: 0.68–0.94); they were, however, more likely to intend to quit because of a stressful work environment (APR=1.06; 95% CI:1.03–1.08). Intention to quit because of inconvenient work schedules was higher among nurses employed by a hiring agency and working at a fixed location compared to traveling nurses (APR=2.94; 95% CI: 1.20–7.18). Those relatively new at their current job (<5 years) were less likely than those who had worked ≥5 years to intend to quit because of burnout (APR=0.90; 95% CI: 0.84–0.97), but more likely to consider quitting because of the patient population (APR=1.28; 95% CI: 1.04–1.58), and inconvenient work schedules (APR=1.15; 95% CI: 1.01–1.31).
Table 3
Adjusted prevalence ratios (APRs) with corresponding 95% confidence intervals for factors that would contribute to a decision to leave the occupied primary nursing position among those who reported not switching a job in the past 12 months but had ever considered leaving their position (N=20682)
[i] Hospitals excluded mental health facilities but included: Critical Access Hospital (CAH), emergency departments, and other regular hospital administration. Clinic/ambulatory included: nurse-managed health center, private medical practice (clinic, physician office, etc.), public clinics, school health service, outpatient mental health/substance abuse centers, non-hospital based urgent cares, and ambulatory surgery centers. Long-term care facilities included: nursing home unit not in hospital, rehabilitation facility/long-term care, inpatient mental health/substance abuse, correctional facility, and inpatient hospice. Community facility/other included: home health agency/service, occupational health or employee health service, public health or community health agency (not a clinic), government agency other than public/community health or correctional facility, outpatient dialysis center, university or college academic department, insurance company, and call center/telenursing center.
DISCUSSION
Our findings underscore the need to strengthen the nursing workforce, both in numbers and diversity within the US. Ethnic minorities, particularly Blacks and Hispanics were under-represented in the nursing workforce in many states, especially those in the South, including Mississippi, Alabama, South Carolina, and Louisiana. This has implications for health education delivery as health professionals from a given community may have more credibility in overturning strongly entrenched misinformation and vaccine hesitancy among members of their community, underscoring the need for cultural diversity in the workforce14. Furthermore, our secondary analyses indicated that the number of COVID-19 deaths per 100000 population decreased as the number of nurses to each COVID-19 hospitalized case increased. This is an interesting finding, as although research has indicated that within long term-care facilities, higher total nursing hours are associated with a lower probability of experiencing an outbreak and with fewer deaths, state-wide correlations have not been previously assessed15,16.
Our findings also underscore the need to build skills and competency of the nursing workforce in key areas necessary for the containment of infectious diseases. Only 6.1% or 198429 individuals, from extrapolated counts, reported receiving formal training or a certification in critical care, a number that translates to less than half of the estimated 512000 universe of nurses involved in critical care (Society of Critical Care Medicine, 2021)17 from published estimates). Close to a third of nurses in our study (29.0%) felt they needed more training in managing medically complex/special needs patients. The percentage working primarily in infectious disease was <1% at baseline. Enhancements in the nursing curriculum may help nursing students in training to acquire broader skills necessary for epidemic response, including fundamentals of epidemiology, surveillance, social mobilization, psychosocial support, vaccination as well as public communication. This training can also be provided to practicing nurses in the form of continuing professional education18,19. Such training may also reduce vaccine hesitancy among the nursing population in the long-term, as vaccine hesitancy has been noted to be higher among nursing personnel than other HCP20. However, nurses may also play a key role as COVID-19 vaccine ambassadors starting from their households, as 70.9% of nurses were married and 44.2% had at least one child, indicating a pathway for addressing misinformation in the broader community.
The utilization of telehealth was relatively low before the pandemic among nurses. Overall, only 1 in 3 nurses (32.9%) indicated that their facility utilized telehealth services, and of these, 50.4% indicated that they personally used telehealth services. Most of the telehealth usage was not for direct patient care, but rather was for inter-provider communication. It is therefore not surprising that baseline report of telehealth use in facilities before the pandemic was not significantly associated with self-reported use of telehealth among patients during the pandemic. Increasing the self-efficacy of nurses in deploying telehealth may help narrow disparities by expanding access to hard-to-reach communities, as many competencies for telehealth, including clinical knowledge and communication skills, are not novel competencies within the nursing workforce21. Within this context, the COVID-19 pandemic may have acted catalytically in the adoption of telehealth within the nursing profession22-25, the implications of which will become evident in the near future26.
In the nearly two years of the COVID-19 pandemic, nurses and other HCP have worked relentlessly under physically and emotionally challenging situations, with a significant impact on both themselves and their families27,28. This has been compounded by COVID-related infections and deaths from HCPs, further reducing the workforce29. There may be anticipated impacts from such stressors in relation to attrition of the workforce, especially in places that need help the most. In line with previous knowledge, burnout, physically challenging work, and insufficient staffing were factors why many nurses would consider quitting their work, especially those with low remuneration and those newer in the nursing profession30-32. A comprehensive approach may help reduce these challenges including greater hiring (17.3% of licensed nurses were unemployed at the time of the study), increased remuneration (e.g. hazard allowances), incentivizing nurses to serve in areas where the need is greater, allowing nurses to practice across state lines, and a support system to increase the quality of life (e.g. childcare system), factors which may help sustain and grow the workforce33.
Limitations
This study has some limitations. First, all survey measures were self-reported and may be susceptible to recall bias. Moreover, as these associations are based on cross-sectional analyses only associations and correlations can be indicated, without the ability to indicate causal pathways. Nonetheless, these findings provide a useful framework to reimagine the future of nursing in a world characterized by emerging and re-emerging infectious diseases and other public health emergencies.
CONCLUSIONS
In the US, even before COVID-19, wide variations existed in the number of nurses per 1000 population; states with a low baseline supply of nurses reported higher COVID-19 mortality. Other challenges with the workforce were the limited diversity of the workforce, particularly in certain Southern States with Blacks and Hispanics under-represented in the nursing profession. Attention is also needed to increase self-efficacy in the utilization of telehealth applications as well as expanding their use beyond provider-to-provider communication. Holistic approaches to address burnout are also needed to minimize attrition and improve the quality of life of nurses nationwide.