

INTRODUCTION
Tobacco smoking remains one of the leading preventable causes of illness and premature death worldwide1. Globally, over 1.3 billion people use tobacco products, with cigarette smoking accounting for the majority of tobacco-related morbidity and mortality2,3. Despite decades of tobacco control efforts, the World Health Organization (WHO) estimates that tobacco use kills more than 8 million people annually4, including around 1.2 million deaths caused by secondhand smoke exposure5. Adolescence is a critical period when tobacco habits are often formed, with early initiation strongly linked to lifelong addiction and increased risk of non-communicable diseases such as cardiovascular disease, cancer, and chronic respiratory conditions6.
In Africa, cigarette smoking patterns reflect a complex interplay of cultural, social, and economic factors, along with varying enforcement of tobacco control policies6,7. While overall smoking prevalence remains lower in many African countries8 compared to global averages, recent trends indicate rising tobacco use among youths, especially in urban settings9. Regional studies show that approximately 10% of African school-going adolescents currently smoke cigarettes with significant variations by age, sex, and country10. Male adolescents consistently report higher smoking rates than females, reflecting gender norms and marketing strategies targeting young men10,11. Meanwhile, exposure to tobacco advertising12 and weak enforcement of tobacco advertising and promotion bans, continue to hinder efforts to reduce youth tobacco use13.
This study analyzes secondary data from the GYTS in 45 African countries. Adolescents are a crucial group for monitoring tobacco use since experimentation and initiation often start during this developmental stage14. Most smokers start young15 with a significant number of adult smokers having started before the age of 25 years16. Early onset tobacco use is harmful to adolescents whose brains are still developing affecting attention, learning and impulse control15. Early tobacco use also predicts lifelong addiction14. School going adolescents are targeted for collecting data during the surveys because they are easily accessible and the school environment enhances standardized sampling and data comparability across countries17. Using schools as survey sites enhances logistical feasibility and facilitates efficient data collection17.
This study aims to assess the prevalence and determinants of current cigarette smoking among school-going adolescents across Africa. It focuses on how demographic, behavioral, and policy-related factors influence smoking behaviors over time. Specifically, the study estimates smoking prevalence among youths aged 11–19 years in 45 African countries, exploring variations by age, sex, school grade, and country. It identifies key associates of smoking including the use of other tobacco products and exposure to tobacco advertising and anti-smoking media.
METHODS
Data source
This study analyzed secondary data from the Global Youth Tobacco Survey (GYTS), collected using a cross-sectional study design between 2001 and 2021 across 45 African countries. The survey targeted school-going adolescents aged 11–19 years, gathering detailed information on tobacco use, exposure to tobacco advertising, anti-smoking media awareness, school-based tobacco education, and perceptions of tobacco control policies. The GYTS is designed to generate a cross-sectional national representative sample. It has a standardized methodology for the sampling framework, selection of schools and classes, and data processing. The survey employs a standard questionnaire with core questions and optional questions which allow adaptation to the needs of a particular country. A more detailed description of the overall objectives and methodology of the GYTS are available elsewhere17. The schools and sample size are determined using a standard procedure and software developed by the Center for Disease Control and Prevention (CDC) once it receives the sampling frame from the GYTS research coordinators. The actual sample size and its computation was not available; however, a minimum sample size of 1500 students, 50% of whom are female is required for the GYTS17. A total of 439322 school going adolescents from 45 countries in Africa were surveyed between 2001 and 2021. Each country’s survey used a two-stage cluster sampling design to ensure nationally representative samples of school going youths.
Ethics
Ethical approval was obtained from the University of Zambia Biomedical Research Ethics Committee (Approval number: 7265-2025; Date: 13 November 2025) and the National Health Research Authority of Zambia (Approval number: NHRA-2899/14/11/2025; Date: 14 November 2025), in compliance with national research guidelines. Access to the anonymized GYTS datasets was granted by the WHO through the NCD Microdata Repository. As the study involved no direct contact with participants and used de-identified data, no additional consent was required.
This study is a secondary analysis of de-identified GYTS data. The authors accessed the data through an approved data request to the World Health Organization. The analysis involved no direct contact with participants and did not require additional ethical approval, as the datasets were fully anonymized.
Data management
The primary outcome variable was current cigarette smoking that was generated from the question, ‘During the past 30 days (one month), on how many days did you smoke cigarettes (including manufactured or hand-rolled cigarettes)?’ with response options: 0, 1–2, 3–5, 6–9, 10–19, 20–29, 30 days. Participants who smoked cigarettes at least once (Yes) in the last 30 days were classified as current cigarette smokers, while those who did not (No) were classified as non-current cigarette smokers.
Independent variables
Sociodemographic factors
Sociodemographic characteristics included: age (≥11, 12, 13, 14, 15, 16, 17, 18, and ≥19 years), sex (male, female) and grade (6, 7, 8, 9, 10, 11, 12, 13 and ≥14).
Behavioral and tobacco marketing factors
Our study used seven questions from the questionnaire to which the students answered ‘Yes’ or ‘No’: 1) ‘During the last 30 days, did you ever try smokeless chewed tobacco?’; 2) ‘During the last 30 days, did you ever try using snuff?’; 3) ‘During the last 30 days, did you ever try smoking shisha?’; 4) ‘During the last 30 days, did you ever use chewing tobacco?’ Students who answered ‘Yes’ were classified as smokeless chewed tobacco, snuff, shisha and chewing tobacco users, respectively, otherwise they were not. Participants were also asked: 5) ‘During the past 30 days, how often did you see any people using tobacco products on TV, the internet or social media (Facebook, Twitter, Instagram, TikTok or YouTube)?’; 6) ‘Do you own anything other than a tobacco product (for example, t-shirt, pen, backpack, hat, and ball) with a tobacco product brand logo on it?’. Students who answered ‘Yes’ in either case were classified as having been exposed to tobacco marketing. Students who responded ‘Yes’ to the question: 7) ‘During the past 30 days, did you see or hear any messages against the use of tobacco products in the media?’ were classified as having been exposed to anti-tobacco use ads in the media otherwise they were not.
School curriculum factors
This was generated from the question, ‘During the past 12 months, were you taught in classes at school about the dangers of using tobacco products?’. To which the students responded ‘Yes’ or ‘No’.
Policy factors
This covariate had four questions to which the students responded ‘Yes’ or ‘No’; 1) ‘Do you support banning of tobacco smoking in public?’; 2) ‘Do you support banning of tobacco sales to minors (under 18)?’; 3) ‘Do you support banning of tobacco advertising and promotions?’; and 4) ‘Are you aware of the tobacco act?’.
Categorical variables were re-coded by harmonizing response categories and applying binary transformations. Variables originally coded numerically or with multiple responses such as current smoking status, use of chewing tobacco, exposure to smoking advertisements and ownership of tobacco branded items were dichotomized as ‘Yes’ or ‘No’ based on original survey responses. The value of 1 or equivalent affirmative responses denoted ‘Yes’ while all other responses were ‘No’. Inconsistently coded variables such as banning of smoking in public places which originally contained both numeric and string values were standardized (unified binary format) to ensure they were comparable across countries and survey years. Variables such as taught in school about the effects of smoking were collapsed into ‘Yes’ vs ‘No’ categories for easy interpretation. Age and grade were grouped into categories, and all categorical variables were treated as factor variables to facilitate inclusion in regression analysis. Potential confounders (age, sex, school grade, country, and survey year) were identified a priori and adjusted for in multivariable models.
Statistical analysis
Data cleaning and preprocessing
We ensured consistent coding across different countries and years by standardizing variable labels and responses. Missing data were addressed using deterministic and distribution-based imputations, aimed at reducing bias, improve completeness and preserve statistical power. Missing age values, <11 years or >19 years were replaced with the median (15 years) or capped at 19 years, while missing sex data were imputed using observed distribution-based sampling. Missing school grades or exceeding 14 were set to the mode (grade 9) or capped at 14. All categorical data were converted to categorical variables for analysis, and clear labels were assigned for ease of interpretation. A composite indicator for current smoking was created using all available tobacco use measures to strengthen the reliability of the outcome. Data were assumed to be missing at random (MAR) given the low levels of missingness and its likely dependence on observed variables. However, missing not at random (MNAR) for self-reported behaviors cannot completely be excluded due to social desirability and under-reporting.
Descriptive summaries were applied to obtain frequencies and proportions of current cigarette smokers and non-cigarette smokers across sociodemographic, behavioral, and policy related factors18. The chi-squared test was used to determine associations between various factors and current cigarette smoking status. Unadjusted logistic regression models were utilized to explore crude relationships between each factor and current cigarette smoking19. Variables that were found to be significantly associated (p<0.05) with current cigarette smoking status in the univariate analyses were included in the multivariate models, refined by stepwise selection guided by the Akaike information criterion (AIC) to identify independent predictors. Multicollinearity assessment using variance inflation factor (IVF), goodness of fit evaluation (Hosmer-Lemeshow test) and residual and influence diagnostics, were employed as model diagnostics. To complement inferential statistics, Elastic Net logistic regression (α=0.5) and Random Forest Classifier machine learning models were used. Machine learning model performance was evaluated using the area under the receiver operating characteristic curve (AUC) and classification accuracy. All statistical tests were conducted using a significance level of 0.05, with results considered significant at p<0.05. All analyses were conducted in R (version 4.3.1), using packages such as tidyverse, gtsummary/gt, glmnet, randomForest and pROC.
RESULTS
Characteristics of study participants
This study analyzed data from 439322 school-going youths aged 11–19 years. The data covered 45 countries across Africa with South Africa contributing 6.5% while Angola, Gabon, and Liberia, contributed a total of 1.2%. The sample had a balanced gender distribution, with 50.3% female and 49.7% male (Supplementary file Table 1). The majority of the respondents were aged 13–16 years, peaking at age 14 years (20.0%) and 15 years (20.1%) before declining to 16% and 13% among those aged 16 and 17 years, respectively. Adolescents aged 11 and 12 years accounted for a combined 14.3%, while those aged 18 and 19 years constituted 1.3%. As shown in Supplementary file Table 1, adolescents in grades 7–11 accounted for the majority of the respondents, especially those in grades 9 (21.5%) and 10 (19.6%).
Almost all the students (98.6%) had seen smoking advertisements and notably 15.7% owned a tobacco branded item, while 78.6% reported exposure to anti-smoking messages. A small number of participants reported having used chewing tobacco (3.3%).
Support for banning of tobacco smoking in public was 59.6%, while that of tobacco sales to minors (3.5%) and tobacco advertising (1.6%) were low.
Prevalence of cigarette smoking
Table 1 shows the prevalence of cigarette smoking across demographic, behavioral, environmental, and policy-related factors among students included in the study (n=439322). Some of the highest prevalence of cigarette smoking were found in Burkina Faso (48.93%; 95% CI: 47.96–49.89), South Africa (18.94%; 95% CI: 18.47–19.42), Seychelles (18.84%; 95% CI: 17.75–19.94), and Mali (18.01%; 95% CI: 17.04–18.98) (Table 1). The highest smoking prevalence was recorded in 2006 (20.85%; 95% CI: 20.40–21.30) and 2011 (17.70%; 95% CI: 17.12–18.28). The overall prevalence of cigarette smoking among the respondents was 23.88% (95% CI: 20.20–27.57) with the highest prevalence seen among the those aged 18 years (22.41%; 95% CI: 21.26–23.57) followed by adolescents aged 17 years (15.29%; 95% CI: 14.98–15.60).
Table 1
Prevalence of cigarette smoking among school-going adolescents, a cross-sectional secondary analysis of the Global Youth Tobacco Survey in 45 African Countries, 2001–2021 (N=439322)
In addition, the prevalence of behavioral environmental and policy factors related to smoking are outlined in Table 2.
Table 2
Prevalence of cigarette smoking among school-going adolescents, a cross-sectional secondary analysis of the Global Youth Tobacco Survey in 45 African Countries, 2001–2021 (N=439322)
The multivariable logistic regression analysis reviewed several demographic and behavioral factors associated with current cigarette smoking among adolescents (Table 3). Male students had significantly higher odds of smoking than females (AOR=3.21; 95% CI: 3.09–3.34; p< 0.001). The odds of smoking cigarettes increased with age peaking at 18 years (AOR=2.05; 95% CI: 1.78–2.36; p<0.001). Similarly, students in higher school grades were more likely to smoke than those in lower grades with the adjusted odds ratio highest in grade 12 (AOR=1.22; 95% CI: 1.09–1.37; p<0.001). The most significant factor associated with cigarette smoking was chewing tobacco, with users having nearly five times the odds of smoking cigarettes compared to non-smokers (AOR=4.83; 95% CI: 4.62–5.05; p<0.001). Those exposed to pro-smoking advertising had almost double the odds (AOR=1.98; 95% CI: 1.77–2.22; p<0.001), while those who owned a tobacco-branded item had more than twice the odds of smoking (AOR=2.61; 95% CI: 2.51–2.71; p<0.001). Country-level variations were also visible. The highest adjusted odds were observed in Seychelles (AOR=2.03; 95% CI: 1.79–2.31; p<0.001).
Table 3
Crude and adjusted odds ratios for cigarette smoking among school-going adolescents, a crosssectional secondary analysis of the Global Youth Tobacco Survey in 45 African Countries, 2001–2021 (N=439322)
[i] AOR: adjusted odds ratio. Adjusted model includes sex, age, school grade, country, survey year, tobacco chewing, pro-smoking advertising exposure, anti-tobacco media exposure, tobacco sales ban to minors, smoking ban in public places, ban on tobacco advertisements, and ownership of tobacco-branded items. OR values are illustrative estimates derived from descriptive proportions in the source dataset. A p<0.05 considered statistically significant.
Several variables were associated with lower odds of smoking after adjusting for other factors. Exposure to anti-tobacco media messages was associated with 15% lower odds of smoking (AOR=0.85; 95% CI: 0.82–0.88; p<0.001). Banning of cigarette sales to minors (AOR= 0.79; 95% CI: 0.74–0.84; p<0.001) and tobacco advertisements (AOR=0.80; 95% CI: 0.75–0.86; p<0.001) had lower odds of smoking. Eritrea had the lowest adjusted odds of cigarette smoking (AOR=0.46; 95% CI: 0.40–0.52; p<0.001).
Model performance for Elastic Net (α=0.5) and the Random Forest
In this study, two predictive models, Elastic Net (α=0.5) and the Random Forest models were used to correctly rank cigarette smoking and non-smoking cases (Table 4). Both models were comparable in separating classes (AUC=0.762). However, the Random Forest exhibited better accuracy, though marginal, and therefore provided better prediction reliability.
Smoking probabilities by country
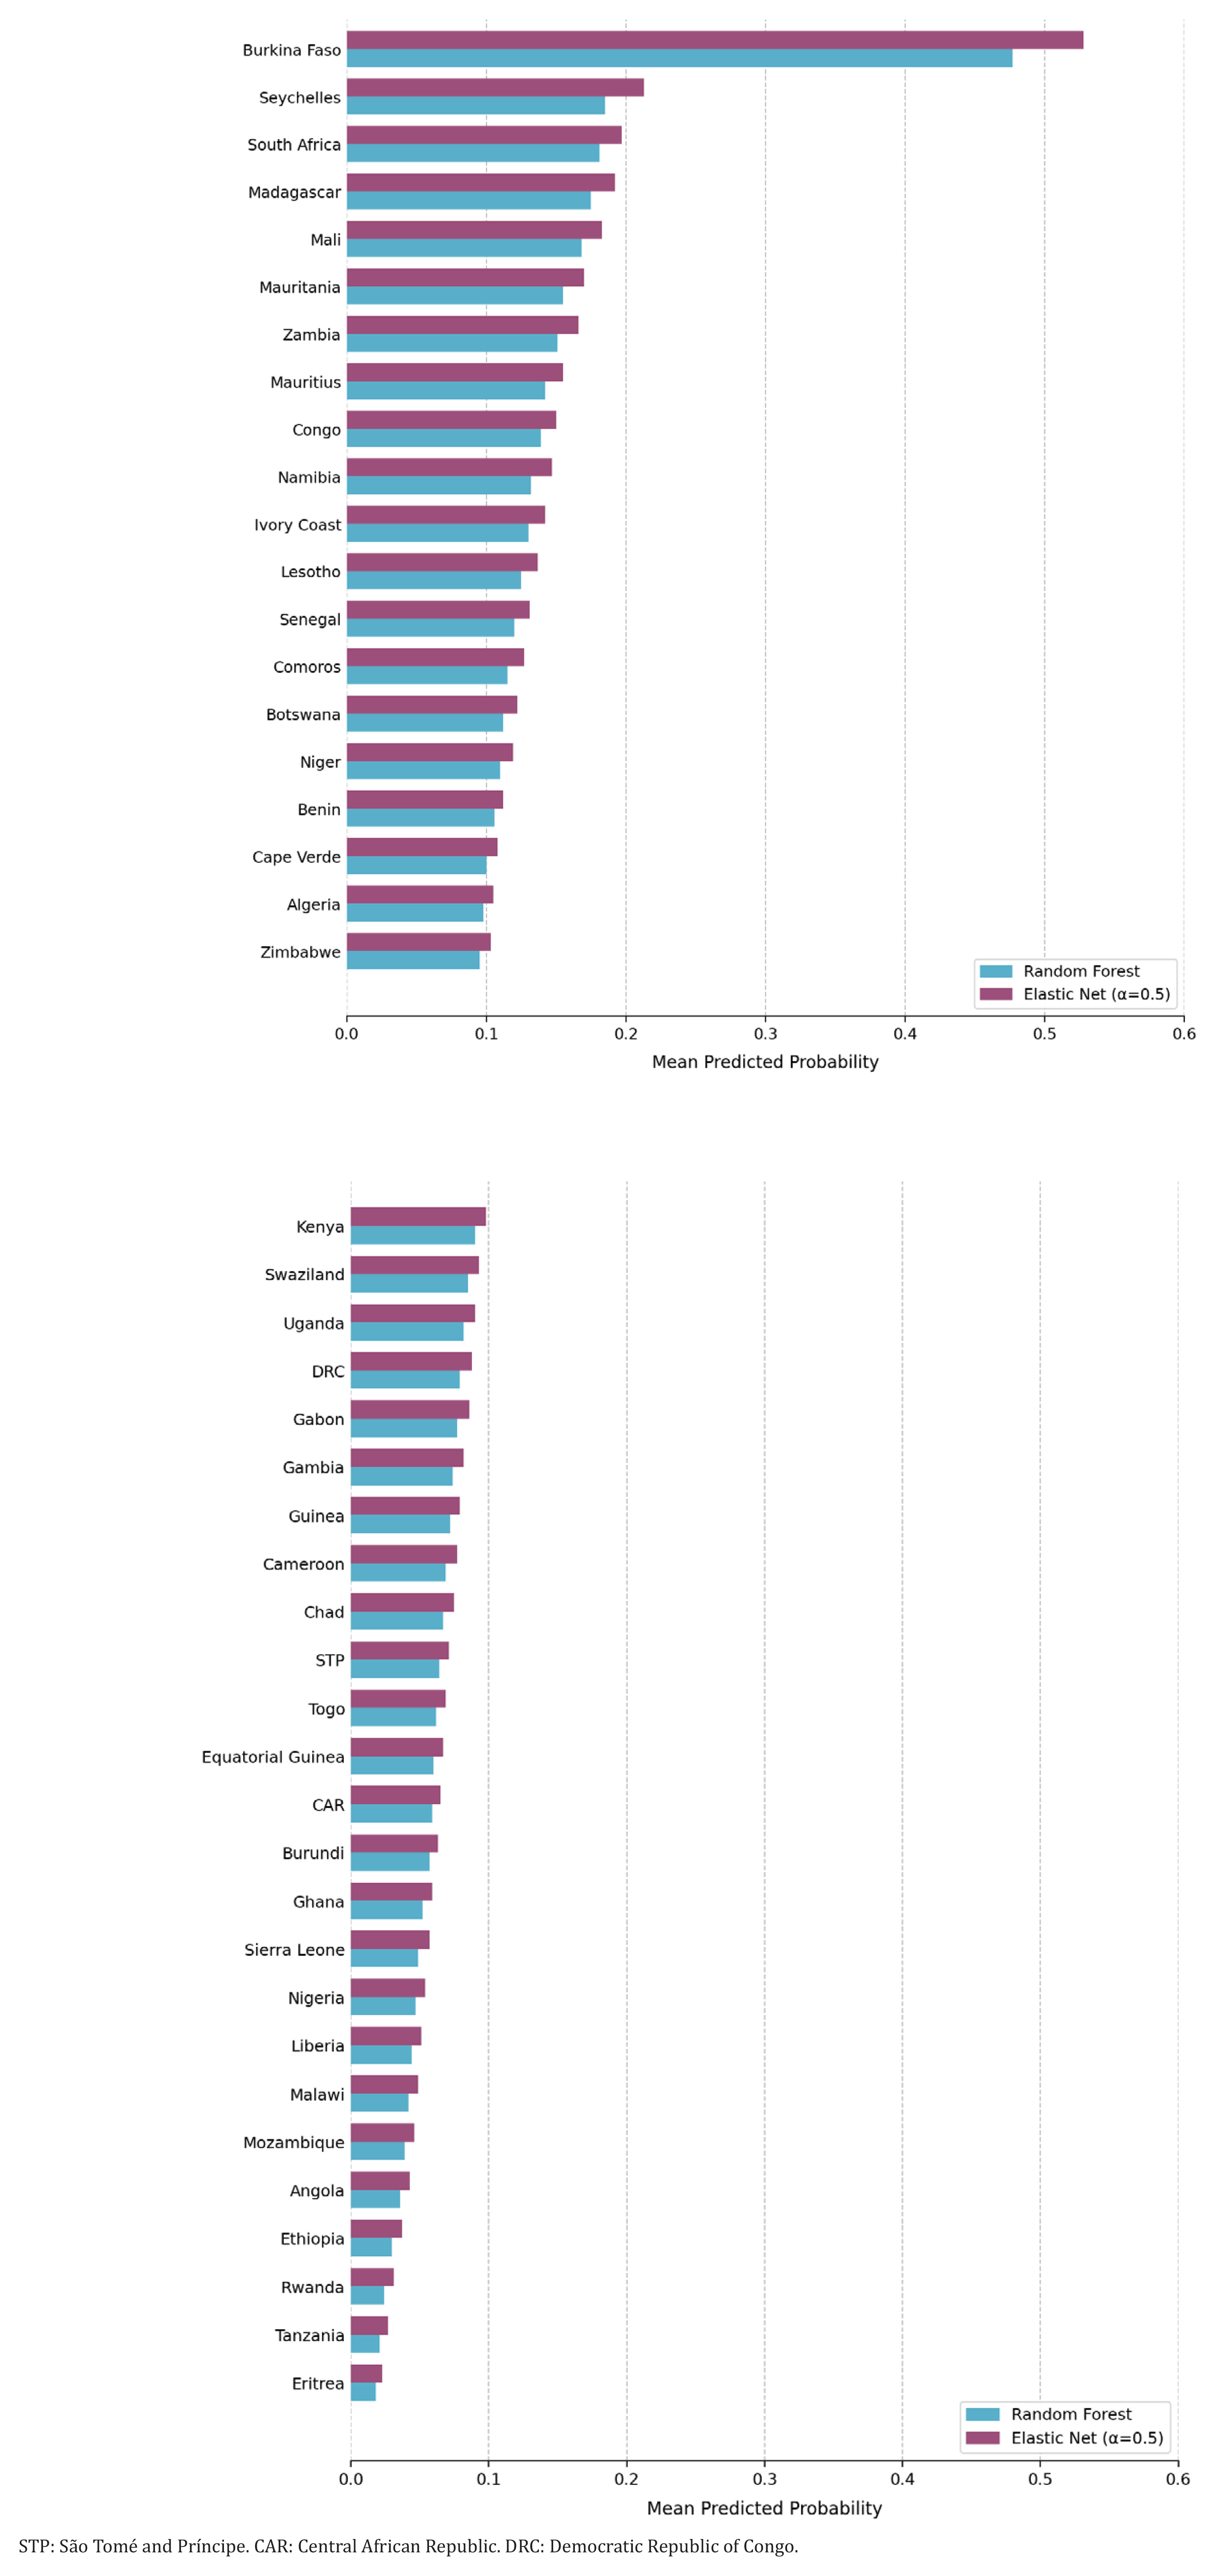
Figure 1 illustrates the mean predicted cigarette smoking probability by country. The graph reviews distinct variations in the mean predicted probability of smoking in 45 African countries, with the majority showing relatively low predicted probabilities, an indication of a lower estimated likelihood of cigarette smoking among adolescents. However, a number of countries such as Burkina Faso, Seychelles, South Africa and Mali (Figure 1) had higher values. The two predictive approaches employed in the analysis produced comparable estimates with minimal differences and country rankings which support the reliability of the observed patterns. The mean predicted probability was marginally higher using the Elastic Net than the Random Forest. For instance, the predictive probabilities for smoking in Burkina Faso using the Elastic Net and the Random Forest were approximately 0.52 and 0.47 respectively (Figure 1).
Smoking probabilities by age group and sex
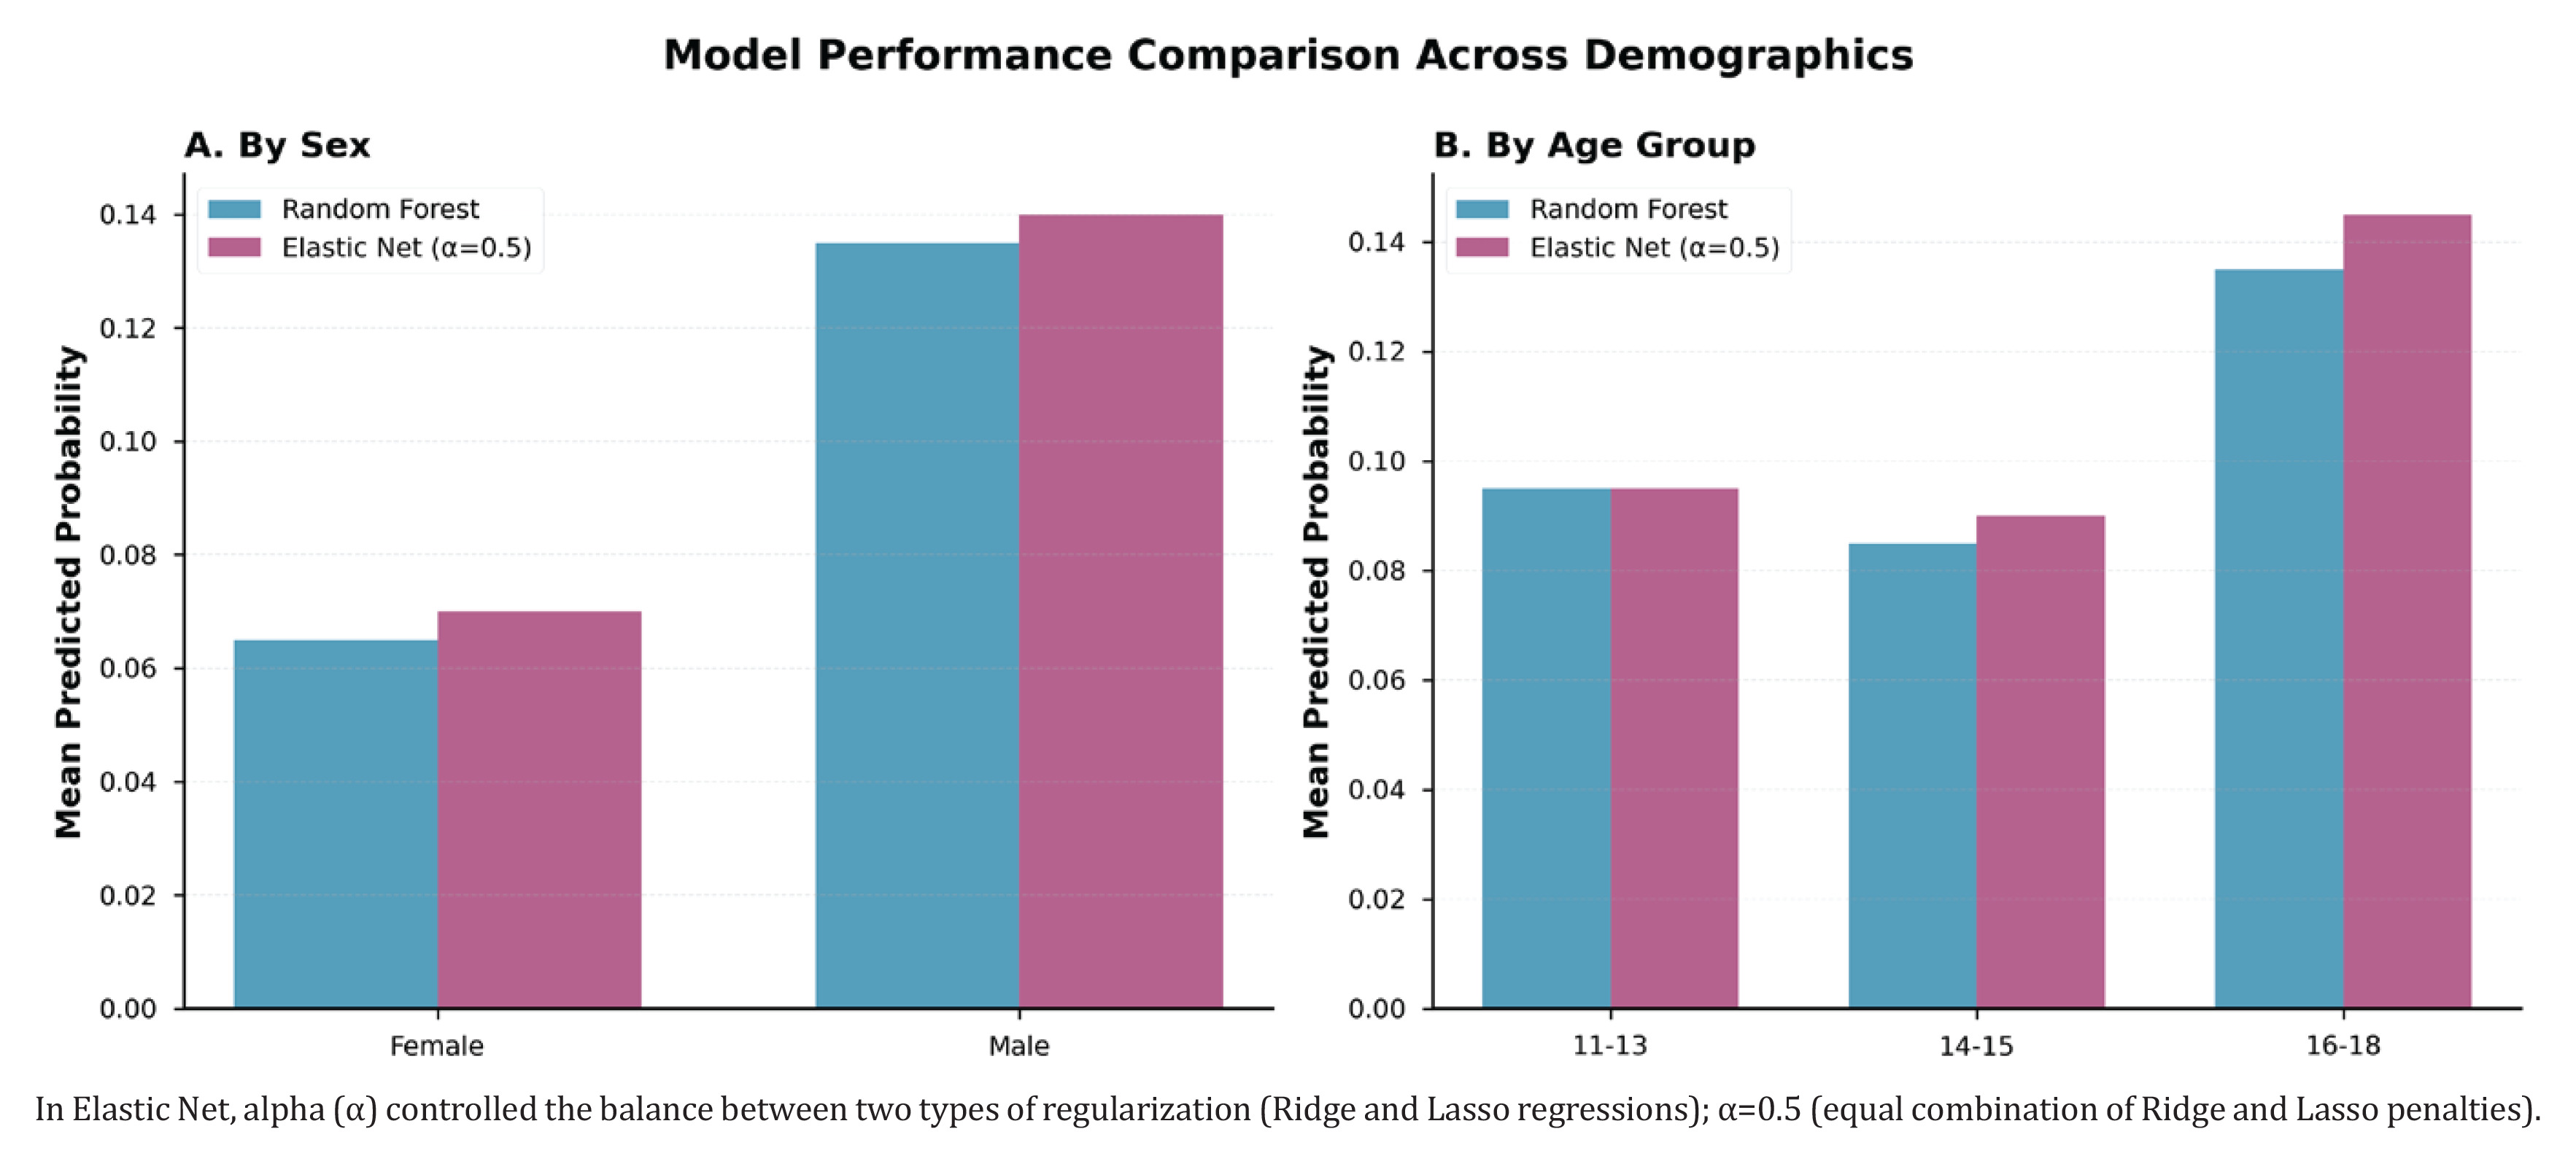
As shown in Figure 2, the comparison of the mean predicted probability by gender using the Random Forest and the Elastic Net (α=0.5) predictive models indicated a consistent pattern between the two, with males showing higher probability than females. Using the Elastic Net, the predicted mean for males was 0.14 while that of females was 0.07. Similarly, the predicted mean for males was about 0.135 versus 0.065 for females using the Random Forest. The production of almost identical predictions by the models within each sex category, indicated a strong alignment between the modelling techniques. The predicted probabilities increased steadily with age reaching a peak between 16 and 18 years (Elastic Net 0.143 vs 0.135 Random Forest), followed by 14–15 years and finally the 11–13 years. The increase is noticeable in both models but it is slightly higher in the Elastic Net model in the older age group. Regionally, Southern Africa demonstrated the highest predicted probability, followed by West Africa, Central Africa, and East Africa. As observed under gender and age demographics, the Elastic Net model produced slightly higher probabilities than the Random Forest across regions (Supplementary file Figure 1).
Figure 2
Comparison of predictive model performance across demographic groups for cigarette smoking among school-going adolescents, a cross-sectional secondary analysis of the Global Youth Tobacco Survey in 45 African Countries, 2001–2021 (N=439322)
Regarding model prediction differences, the distribution of prediction was concentrated around zero (0.00) with the majority of values clustered around the no difference line (Supplementary file Figure 1).
Smoking probabilities by age-sex groups
Figure 3 illustrates the predicted probability of cigarette smoking among adolescents aged 11–18 years, disaggregated by gender using Random Forest and Elastic Net (α=0.5) predictive models. Among female adolescents, the predicted probability was low in early adolescence and steadily declined between the ages of 13 and 14 years before gradually increasing. The sharpest increase in both models was observed between the ages of 16 and 18 years. The predictive models produced comparable estimates for both males and females across all ages indicating a consistent pattern prediction regardless of the modeling approach used. The similarity between curves among female adolescents indicates that age-related variations in smoking risk is strong and not model-dependent. The predicted probability among males was uniformly higher than that observed among female adolescents. It initially declined in early adolescence (12–13 years) before steadily rising from age 15 years. The sharpest rise was observed between the age of 17 and 18 years. Both predictive models showed a uniform course, although the Elastic Net predictions were higher at older ages.
Figure 3
Predicted probability of cigarette smoking by age and sex among school-going adolescents, a cross-sectional secondary analysis of the Global Youth Tobacco Survey in 45 African Countries, 2001–2021 (N=439322)
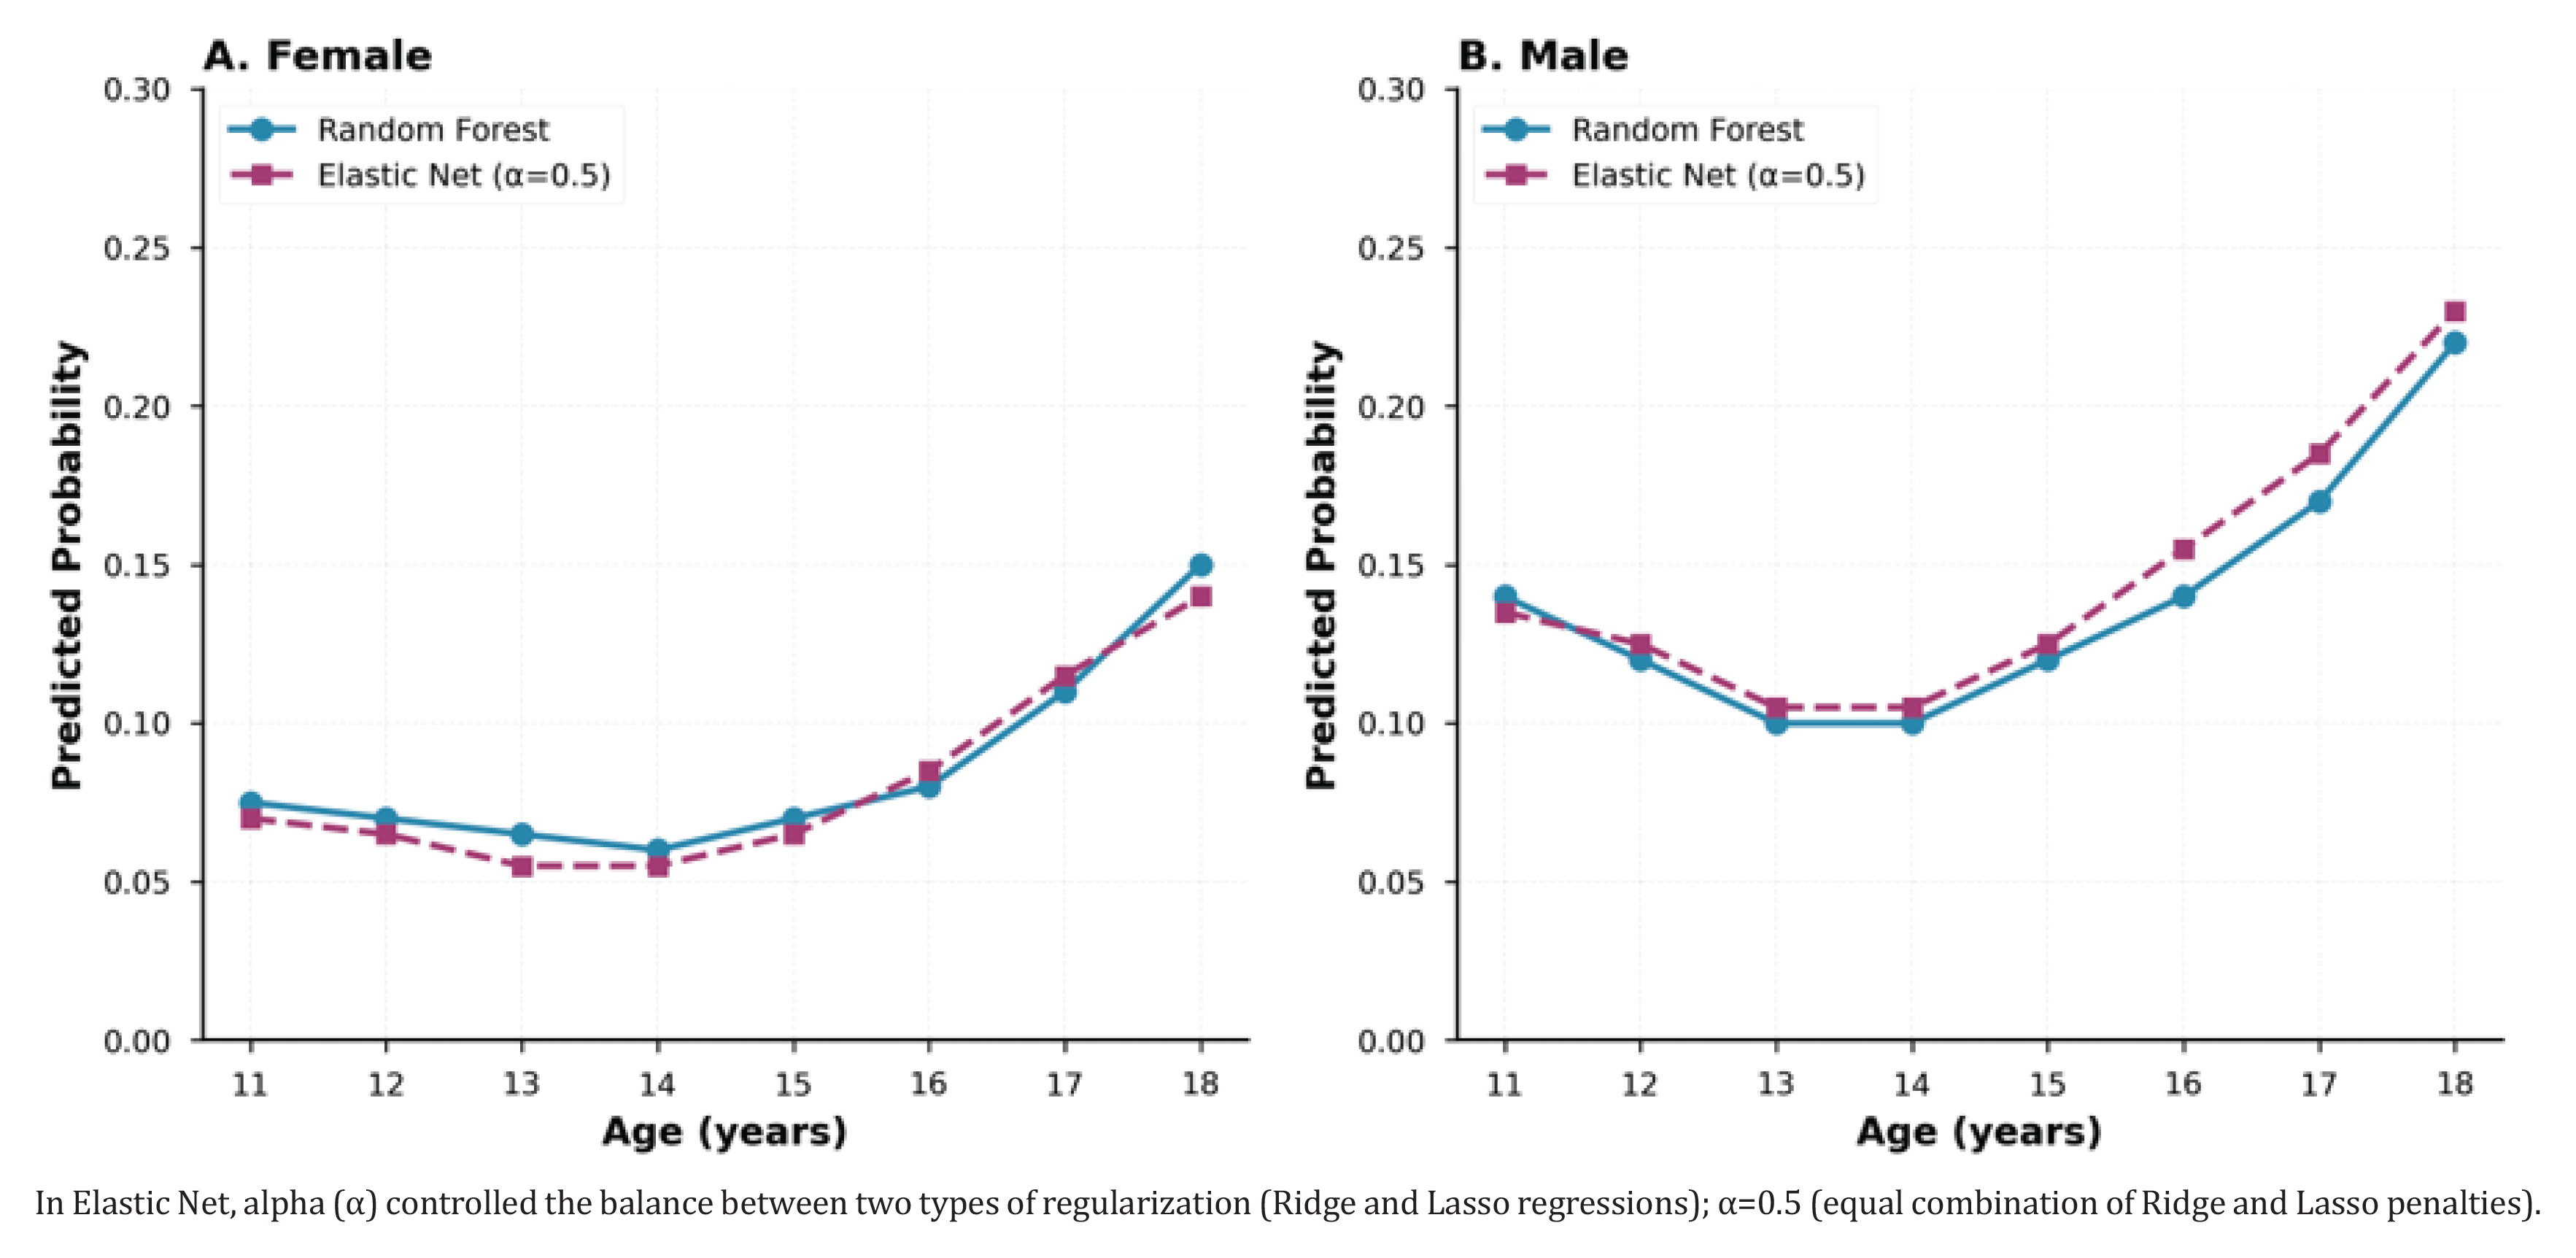
In general, the pattern observed reviewed a robust age-related increase of cigarette smoking risk among males than females, with close alignment of the two modeling techniques.
DISCUSSION
This study aimed to estimate the prevalence of cigarette smoking and examine the sociodemographic, behavioral, and tobacco related policy factors associated with cigarette smoking among school going adolescents in African countries. The likelihood of smoking varied across countries with the highest odds recorded in Seychelles. The results showed an increase in cigarette smoking with increasing age and school grade. Overall, male participants had significantly higher odds of smoking than their female counterparts. The use of other tobacco products such as chew, snuff, or shisha was strongly associated with cigarette smoking. Additionally, ownership of branded tobacco items emerged as a significant factor with participants who owned branded tobacco items more likely to smoke than those who did not. Adolescents who were exposed to smoking advertising had higher odds of cigarette smoking compared to those who were not. Exposure to anti-smoking in the media was on the other hand associated with lower odds of smoking. Notably, students who supported banning of tobacco sales to minors, tobacco advertising and tobacco smoking in public, were less likely to smoke cigarettes compared to their counterparts. These findings offer insights into the prevalence and predictors of cigarette smoking among school-going adolescents across countries in Africa.
The pooled cigarette smoking prevalence from the study was above the global estimates from the World Health Organization (WHO)20. This high prevalence is inconsistent with other studies done globally16. However, a study done in Eastern Ethiopia among adolescents equally had a prevalence rate above the WHO threshold21. This high cigarette smoking result could be attributed to aggressive and innovative tobacco marketing strategies employed by tobacco companies in Africa that appeal to the youth10.
The increase in cigarette smoking with age22 and school grade mirrors patterns seen worldwide23,24. This rise is influenced by peer pressure, stress related to social transitions and increasing autonomy25,26. These findings underscore the need to understand factors driving youth tobacco initiation and progression to regular smoking.
The predominance of cigarette smoking among male students observed in the study, reflects a consistent pattern seen both globally and across Africa10,27. Cultural norms and gender roles often influence tobacco use, with males more socially permitted to smoke28.
The association between other tobacco product use and cigarette smoking reflects global evidence on dual and poly-tobacco use among youth29. Adolescents who have used non-cigarette tobacco products were more likely to initiate cigarette smoking30. A prospective cohort study of the Population Assessment of Tobacco and Health involving youths in the US reviewed that youths who used non-cigarette products were more likely to initiate cigarette smoking a year later, compared to youths who had never used any tobacco products31. A number of factors could explain this association. Other tobacco products might cause nicotine dependence32 which some youths perceive might only be satisfied by conventional cigarettes. Additionally, youths might consider cigarettes to be more convenient than other tobacco products31.
The association between ownership of branded tobacco items and smoking was strong in our study. Previous research has shown that ownership of branded tobacco items was associated with cigarette smoking33. Branding of items is part of a strategy utilized by tobacco multinational companies called TAPS (tobacco advertising, promotion and sponsorship)33. Exposure to TAPS has been shown to increase tobacco initiation and continued use among the youth33. In our study, adolescents who were exposed to cigarette smoking advertising had higher odds of smoking cigarettes while those exposed to anti-smoking advertising in the media were less likely to smoke. This finding conforms with the majority of existing literature, which reports higher smoking rates among adolescents exposed to tobacco advertising and lower smoking rates for adolescents exposed to anti-smoking messages33.
In our study, students who supported banning of tobacco sales to minors, tobacco advertising and smoking in public were less likely to smoke cigarettes which conforms with findings from other studies11,26,28. Despite advertising bans in many countries, indirect marketing continues to pose a challenge34,35.
Strengths and limitations
The study is drawn from a large continent-wide dataset spanning two decades with more than 400000 school going adolescents across 45 African countries. It therefore provides a comprehensive overview of the prevalence and predictors of cigarette smoking among school-going adolescents addressing a significant gap in public health literature. By integrating traditional and predictive approaches in the analysis, our study was able to describe and explain observed associations and predict the probability of cigarette smoking among school-going adolescents in the future. In addition, the application of rigorous statistical methods, with adjustments for confounders, strengthens the credibility and robustness of the results.
There are limitations to the study that should be considered when interpreting the results. First, this study relies on self-reported data, which has the potential to introduce reporting bias, including misclassification, particularly under-reporting of smoking due to social desirability, resulting in possible underestimation of the actual prevalence. Secondly, we identified factors associated with cigarette smoking among school-going adolescents; however, due to the cross-sectional design of the study, causal relationships could not be established. While the multivariable model controlled for recognized confounders, residual confounding, often present in observational studies, may still exist and could influence the interpretation of the findings. Thirdly, the generalizability of the findings may be limited, given that the sample was drawn from specific geographical locations and may not be representative of adolescents in other international contexts. Additionally, variability in sample sizes and data collection years across countries may affect comparability.
CONCLUSIONS
This study offers valuable large-scale, multi-country evidence on cigarette smoking among students in Africa, revealing key determinants and substantial variations across different contexts. Further research is necessary to clarify the underlying factors contributing to cigarettes smoking among adolescents. In addition, longitudinal and context specific research across multiple countries are necessary for generating robust evidence on student smoking behaviors. These findings contribute to the existing body of knowledge and highlight the need for continued empirical investigations to enhance understanding of adolescent smoking within the African context.